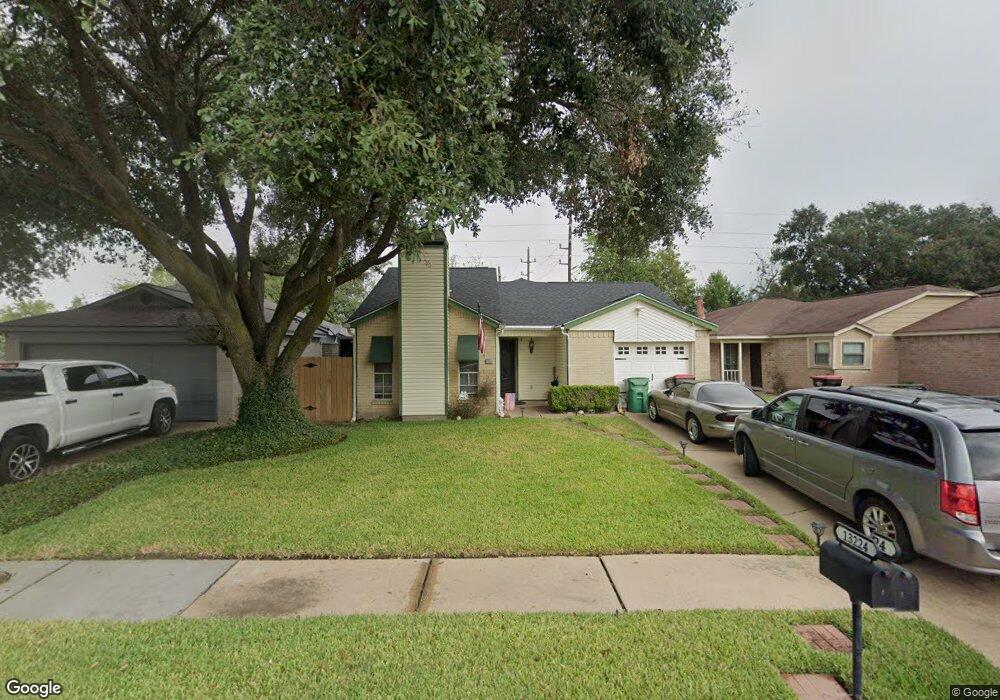
13224 Chimney Sweep Dr Houston, TX 77041
Hearthstone NeighborhoodEstimated Value: $220,000 - $286,000
5
Beds
3
Baths
2,190
Sq Ft
$117/Sq Ft
Est. Value
About This Home
This home is located at 13224 Chimney Sweep Dr, Houston, TX 77041 and is currently estimated at $256,870, approximately $117 per square foot. 13224 Chimney Sweep Dr is a home located in Harris County with nearby schools including Hairgrove Elementary School, Labay Middle School, and Cypress Falls High School.
Ownership History
Date
Name
Owned For
Owner Type
Purchase Details
Closed on
Feb 17, 2003
Sold by
Seminario Teodoro
Bought by
Seminario Karim N
Current Estimated Value
Home Financials for this Owner
Home Financials are based on the most recent Mortgage that was taken out on this home.
Original Mortgage
$69,350
Outstanding Balance
$29,592
Interest Rate
5.9%
Mortgage Type
Purchase Money Mortgage
Estimated Equity
$227,278
Purchase Details
Closed on
Apr 27, 2001
Sold by
Delgado Jesus and Delgado Angie Perez
Bought by
Garcia Emilio and Garcia Lorena
Home Financials for this Owner
Home Financials are based on the most recent Mortgage that was taken out on this home.
Original Mortgage
$65,482
Interest Rate
6.89%
Mortgage Type
FHA
Purchase Details
Closed on
Dec 30, 1994
Sold by
Delgado Jesus C and Delgado Janie G
Bought by
Delgado Jesus
Create a Home Valuation Report for This Property
The Home Valuation Report is an in-depth analysis detailing your home's value as well as a comparison with similar homes in the area
Home Values in the Area
Average Home Value in this Area
Purchase History
| Date | Buyer | Sale Price | Title Company |
|---|---|---|---|
| Seminario Karim N | -- | -- | |
| Garcia Emilio | -- | Chicago Title Insurance Co | |
| Delgado Jesus | -- | -- |
Source: Public Records
Mortgage History
| Date | Status | Borrower | Loan Amount |
|---|---|---|---|
| Open | Seminario Karim N | $69,350 | |
| Closed | Garcia Emilio | $65,482 |
Source: Public Records
Tax History Compared to Growth
Tax History
| Year | Tax Paid | Tax Assessment Tax Assessment Total Assessment is a certain percentage of the fair market value that is determined by local assessors to be the total taxable value of land and additions on the property. | Land | Improvement |
|---|---|---|---|---|
| 2025 | $2,031 | $256,771 | $71,650 | $185,121 |
| 2024 | $2,031 | $275,501 | $71,650 | $203,851 |
| 2023 | $2,031 | $262,545 | $51,490 | $211,055 |
| 2022 | $4,592 | $248,841 | $39,503 | $209,338 |
| 2021 | $4,415 | $202,198 | $39,503 | $162,695 |
| 2020 | $4,175 | $192,697 | $28,606 | $164,091 |
| 2019 | $3,914 | $184,609 | $20,377 | $164,232 |
| 2018 | $999 | $168,346 | $20,377 | $147,969 |
| 2017 | $3,246 | $114,116 | $20,377 | $93,739 |
| 2016 | $2,951 | $103,044 | $20,377 | $82,667 |
| 2015 | $1,935 | $89,639 | $13,508 | $76,131 |
| 2014 | $1,935 | $80,595 | $8,471 | $72,124 |
Source: Public Records
Map
Nearby Homes
- 7530 Lemma Dr
- 13215 Vista Oro Dr
- 7635 Log Cradle Dr
- 13219 Vista Brook Dr
- 13323 Firebrick Dr
- 13322 Chaston Dr
- 7511 Weatherhill Ln
- 7402 Burkridge Dr
- 13202 Chasworth Dr
- 7315 Weatherhill Ln
- 7607 Wovenwood Ln
- 7823 Autumn Hollow Ln
- 13814 Swan Hollow Ln
- 13811 Brannon Field Ln
- 13826 Swan Hollow Ln
- 13122 Eldridge Chase
- 7315 Millbrae Ln
- 7618 Mauna Kai Dr
- 8342 Cassidy Creek Ct
- 8303 Gros Ventre Ln
- 13222 Chimney Sweep Dr
- 13226 Chimney Sweep Dr
- 13220 Chimney Sweep Dr
- 13218 Chimney Sweep Dr
- 7639 Brookleaf Dr
- 13214 Chimney Sweep Dr
- 7635 Brookleaf Dr
- 13219 Chimney Sweep Dr
- 13210 Chimney Sweep Dr
- 13215 Chimney Sweep Dr
- 7631 Brookleaf Dr
- 13234 Chimney Sweep Dr
- 13206 Chimney Sweep Dr
- 13211 Chimney Sweep Dr
- 13222 Pebblewalk Cir N
- 7627 Brookleaf Dr
- 13238 Chimney Sweep Dr
- 13207 Chimney Sweep Dr
- 7634 Lemma Dr
- 13202 Chimney Sweep Dr