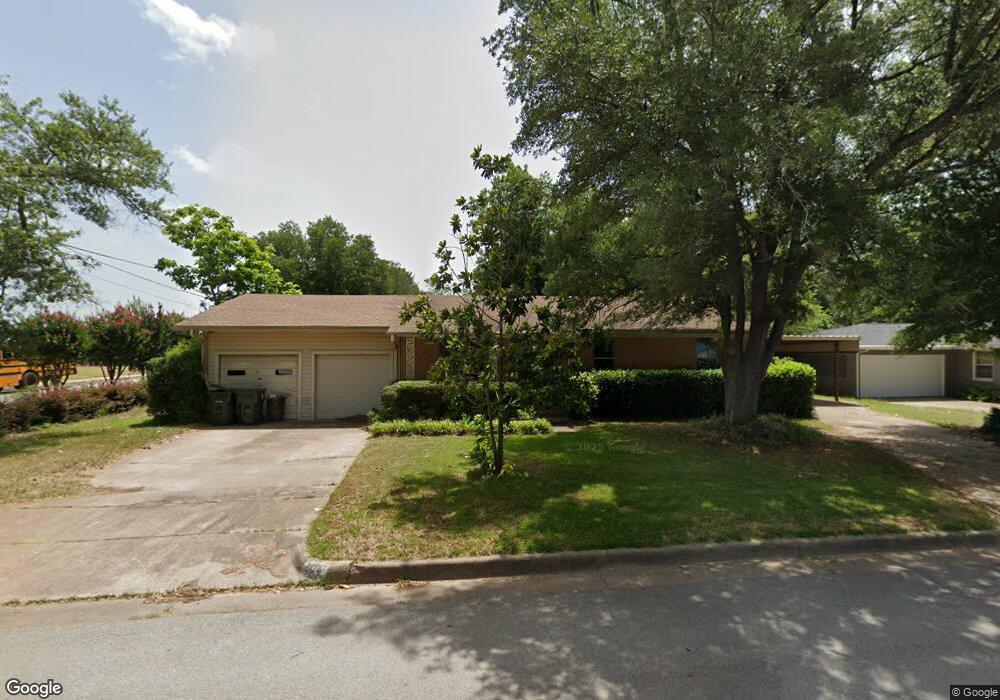
1324 S Tipton Ave Tyler, TX 75701
Midtown Tyler NeighborhoodEstimated Value: $246,000 - $296,000
4
Beds
3
Baths
1,786
Sq Ft
$150/Sq Ft
Est. Value
About This Home
This home is located at 1324 S Tipton Ave, Tyler, TX 75701 and is currently estimated at $268,167, approximately $150 per square foot. 1324 S Tipton Ave is a home located in Smith County with nearby schools including Bell Elementary School, Moore Middle School, and Tyler High School.
Ownership History
Date
Name
Owned For
Owner Type
Purchase Details
Closed on
Dec 27, 2024
Sold by
Martinez Benito Macedo and Castaneda Nicolas Vergara
Bought by
Marks Jennifer
Current Estimated Value
Purchase Details
Closed on
Mar 20, 2024
Sold by
Roy Seymour Family Lp
Bought by
Martinez Benito Macedo and Castaneda Nicolas Vergara
Home Financials for this Owner
Home Financials are based on the most recent Mortgage that was taken out on this home.
Original Mortgage
$138,431
Interest Rate
6.88%
Mortgage Type
Seller Take Back
Purchase Details
Closed on
Mar 13, 2023
Sold by
Sydney C Mcmurray Revocable Trust and Mcguire Amanda
Bought by
Roy Seymour Family Lp
Purchase Details
Closed on
Jan 31, 2007
Sold by
Mcmurray Sydney C
Bought by
Mcmurray Sydney C and Sydney C Mcmurray Revocable Tr
Create a Home Valuation Report for This Property
The Home Valuation Report is an in-depth analysis detailing your home's value as well as a comparison with similar homes in the area
Home Values in the Area
Average Home Value in this Area
Purchase History
| Date | Buyer | Sale Price | Title Company |
|---|---|---|---|
| Marks Jennifer | -- | None Listed On Document | |
| Martinez Benito Macedo | -- | None Listed On Document | |
| Roy Seymour Family Lp | -- | Twin City Title | |
| Mcmurray Sydney C | -- | None Available |
Source: Public Records
Mortgage History
| Date | Status | Borrower | Loan Amount |
|---|---|---|---|
| Previous Owner | Martinez Benito Macedo | $138,431 |
Source: Public Records
Tax History Compared to Growth
Tax History
| Year | Tax Paid | Tax Assessment Tax Assessment Total Assessment is a certain percentage of the fair market value that is determined by local assessors to be the total taxable value of land and additions on the property. | Land | Improvement |
|---|---|---|---|---|
| 2025 | $4,033 | $237,037 | $20,160 | $216,877 |
| 2024 | $4,033 | $237,037 | $20,160 | $216,877 |
| 2023 | $3,600 | $206,532 | $20,160 | $186,372 |
| 2022 | $2,949 | $187,127 | $20,160 | $166,967 |
| 2021 | $2,870 | $136,817 | $20,160 | $116,657 |
| 2020 | $2,777 | $136,875 | $20,160 | $116,715 |
| 2019 | $2,069 | $117,989 | $10,080 | $107,909 |
| 2018 | $2,444 | $112,361 | $10,080 | $102,281 |
| 2017 | $2,400 | $112,413 | $10,080 | $102,333 |
| 2016 | $2,303 | $107,870 | $10,080 | $97,790 |
| 2015 | $528 | $104,048 | $10,080 | $93,968 |
| 2014 | $528 | $103,331 | $10,080 | $93,251 |
Source: Public Records
Map
Nearby Homes
- 2015 E 5th St
- 1914 Parklen St
- 1910 E Lake St
- 1715 Ridgeview Dr
- 834 S Tipton Ave
- 2331 Hunter St
- 912 S Palmer Ave
- 2408 Hunter St
- 1528 E Devine St
- 1730 S Mahon Ave
- 837 S Palmer Ave
- 1725 S Mahon Ave
- 2313 Danica Dr
- 2320 Sarasota Dr
- 1515 E 6th St
- 1432 E Don St
- 1919 E Ferdell St
- 1400 San Antonio St
- 1422 Sunset Dr
- 1520 Clubview Dr
- 2111 Lingner Dr
- 1400 S Tipton Ave
- 2113 Lingner Dr
- 1317 1317 S Tipton
- 1317 1317 Tipton
- 1317 S Tipton Ave
- 1321 S Tipton Ave
- 1313 S Tipton Ave
- 2102 Airline Dr
- 1406 S Tipton Ave
- 2102 2102 Airline Dr
- 2119 Lingner Dr
- 2106 Airline Dr
- 1305 1305 S Tipton
- 1305 S Tipton Ave
- 1405 S Tipton Ave
- 1405 1405 S Tipton
- 2106 2106 Airline Dr
- 1320 Ridgeview Dr
- 1316 Ridgeview Dr