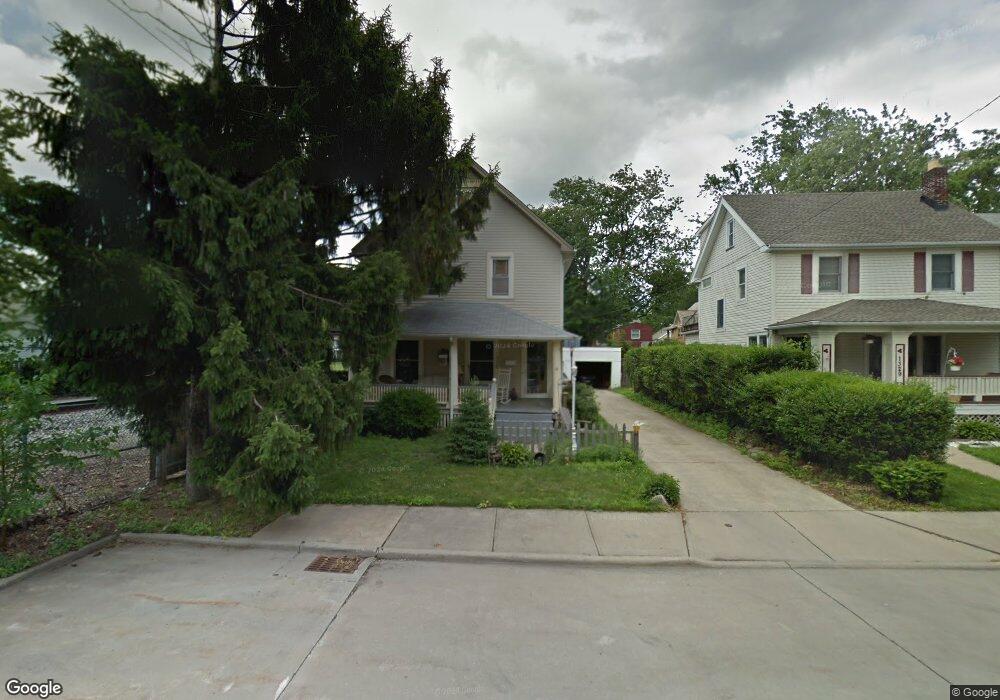
1325 Nelson St Lakewood, OH 44107
Estimated Value: $289,000 - $316,000
4
Beds
2
Baths
1,400
Sq Ft
$218/Sq Ft
Est. Value
About This Home
This home is located at 1325 Nelson St, Lakewood, OH 44107 and is currently estimated at $305,056, approximately $217 per square foot. 1325 Nelson St is a home located in Cuyahoga County with nearby schools including Horace Mann Elementary School, Harding Middle School, and Lakewood High School.
Ownership History
Date
Name
Owned For
Owner Type
Purchase Details
Closed on
Sep 5, 2019
Sold by
2153 Woodward Llc
Bought by
165 Owen Brown Llc
Current Estimated Value
Purchase Details
Closed on
Aug 15, 2017
Sold by
Garvey Susan E and Nationstar Mortgage Llc
Bought by
2153 Woodward Llc
Purchase Details
Closed on
May 28, 1999
Sold by
Ellis Karen M
Bought by
Garvey Susan E
Home Financials for this Owner
Home Financials are based on the most recent Mortgage that was taken out on this home.
Original Mortgage
$74,000
Interest Rate
6.92%
Purchase Details
Closed on
Oct 25, 1984
Sold by
Kozimor Adam
Bought by
Krupansky Raymond J
Purchase Details
Closed on
Jan 25, 1984
Sold by
Kozimor Adam and Kozimor Carmela
Bought by
Kozimor Adam
Purchase Details
Closed on
Jan 1, 1975
Bought by
Kozimor Adam and Kozimor Carmela
Create a Home Valuation Report for This Property
The Home Valuation Report is an in-depth analysis detailing your home's value as well as a comparison with similar homes in the area
Home Values in the Area
Average Home Value in this Area
Purchase History
| Date | Buyer | Sale Price | Title Company |
|---|---|---|---|
| 165 Owen Brown Llc | -- | Title One Ohio | |
| 2153 Woodward Llc | $70,100 | None Available | |
| Garvey Susan E | $82,000 | Prospect Title Agency Inc | |
| Krupansky Raymond J | $37,000 | -- | |
| Kozimor Adam | -- | -- | |
| Kozimor Adam | -- | -- |
Source: Public Records
Mortgage History
| Date | Status | Borrower | Loan Amount |
|---|---|---|---|
| Previous Owner | Garvey Susan E | $74,000 |
Source: Public Records
Tax History Compared to Growth
Tax History
| Year | Tax Paid | Tax Assessment Tax Assessment Total Assessment is a certain percentage of the fair market value that is determined by local assessors to be the total taxable value of land and additions on the property. | Land | Improvement |
|---|---|---|---|---|
| 2024 | $5,386 | $82,005 | $20,195 | $61,810 |
| 2023 | $2,429 | $31,650 | $16,070 | $15,580 |
| 2022 | $2,445 | $31,640 | $16,070 | $15,580 |
| 2021 | $2,421 | $31,640 | $16,070 | $15,580 |
| 2020 | $2,148 | $24,540 | $12,460 | $12,080 |
| 2019 | $2,108 | $70,100 | $35,600 | $34,500 |
| 2018 | $2,105 | $24,540 | $12,460 | $12,080 |
| 2017 | $3,222 | $34,100 | $10,120 | $23,980 |
| 2016 | $3,121 | $34,100 | $10,120 | $23,980 |
| 2015 | $2,950 | $34,100 | $10,120 | $23,980 |
| 2014 | $2,950 | $30,980 | $9,210 | $21,770 |
Source: Public Records
Map
Nearby Homes
- 1354 Webb Rd
- 1271 Edwards Ave
- 1420 Cordova Ave
- 1279 Arlington Rd
- 1462 Spring Garden Ave
- 1227 Ethel Ave
- 17820 Lake Ave
- 1482 Rockway Ave
- 18239 Sloane Ave
- 1500 Lauderdale Ave
- 1437 Woodward Ave
- 16119 Clifton Blvd
- 1244 Brockley Ave
- 1431 Northland Ave
- 1431 Maile Ave
- 1559 Lauderdale Ave
- 1563 Wagar Ave
- 17852 Lake Rd
- 17322 Archdale Ave
- 1464 Riverside Dr
- 1329 Nelson St
- 1331 Nelson St
- 1331 Nelson St Unit 1333 (2nd + 3rd Floor)
- 1335 Nelson St
- 1324 Granger Ave
- 1328 Granger Ave
- 1332 Granger Ave
- 17423 Shaw Ave
- 17419 Shaw Ave
- 17415 Shaw Ave
- 17427 Shaw Ave
- 1328 Nelson St
- 1336 Granger Ave
- 17429 Shaw Ave
- 1332 Nelson St
- 17418 Cannon Ave
- 1310 Granger Ave
- 17422 Cannon Ave
- 17414 Cannon Ave
- 17424 Cannon Ave