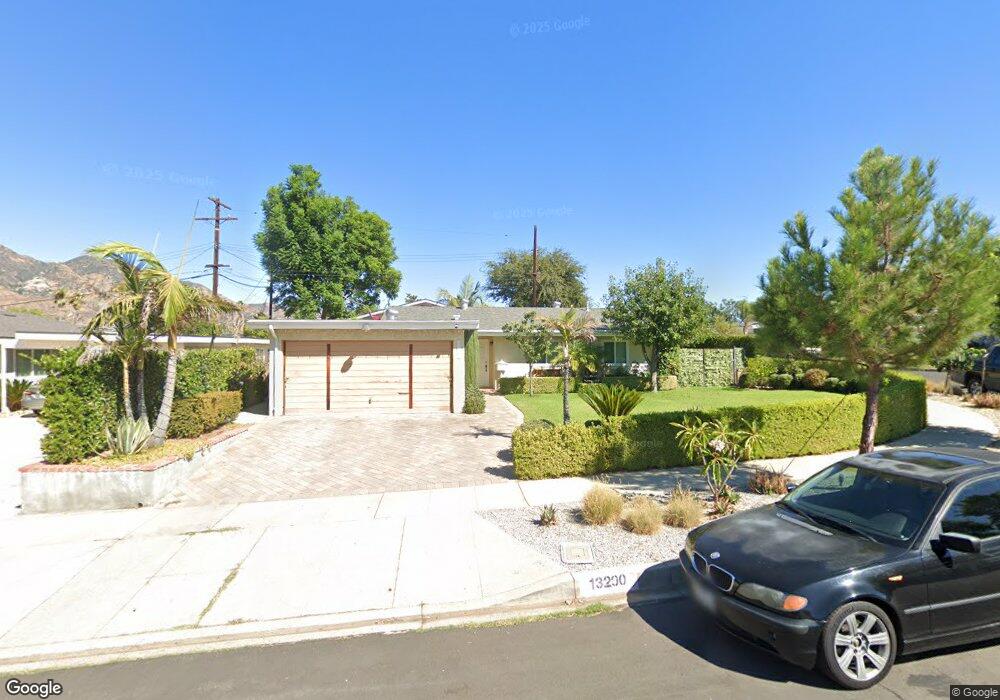
13290 Tripoli Ave Sylmar, CA 91342
Estimated Value: $725,787 - $907,000
3
Beds
2
Baths
1,173
Sq Ft
$709/Sq Ft
Est. Value
About This Home
This home is located at 13290 Tripoli Ave, Sylmar, CA 91342 and is currently estimated at $831,197, approximately $708 per square foot. 13290 Tripoli Ave is a home located in Los Angeles County with nearby schools including Olive Vista Middle School, San Fernando Senior High School, and PUC Community Charter Elementary School.
Ownership History
Date
Name
Owned For
Owner Type
Purchase Details
Closed on
Jan 26, 2015
Sold by
Aleman Pedro Armando and Castro Nora Idalia
Bought by
Aleman Pedro Armando and Castro Nora Idalia
Current Estimated Value
Home Financials for this Owner
Home Financials are based on the most recent Mortgage that was taken out on this home.
Original Mortgage
$264,500
Outstanding Balance
$202,512
Interest Rate
3.75%
Mortgage Type
New Conventional
Estimated Equity
$628,685
Purchase Details
Closed on
May 6, 2011
Sold by
Autumn Investment Inc
Bought by
Aleman Pedro Armando and Castro Nora Idalla
Home Financials for this Owner
Home Financials are based on the most recent Mortgage that was taken out on this home.
Original Mortgage
$272,902
Interest Rate
4.75%
Mortgage Type
FHA
Purchase Details
Closed on
Nov 24, 2010
Sold by
Olguin Linda
Bought by
Autumn Investments Inc
Create a Home Valuation Report for This Property
The Home Valuation Report is an in-depth analysis detailing your home's value as well as a comparison with similar homes in the area
Home Values in the Area
Average Home Value in this Area
Purchase History
| Date | Buyer | Sale Price | Title Company |
|---|---|---|---|
| Aleman Pedro Armando | -- | Lawyers Title | |
| Aleman Pedro Armando | $280,000 | Provident Title Company | |
| Autumn Investments Inc | -- | None Available |
Source: Public Records
Mortgage History
| Date | Status | Borrower | Loan Amount |
|---|---|---|---|
| Open | Aleman Pedro Armando | $264,500 | |
| Closed | Aleman Pedro Armando | $272,902 |
Source: Public Records
Tax History Compared to Growth
Tax History
| Year | Tax Paid | Tax Assessment Tax Assessment Total Assessment is a certain percentage of the fair market value that is determined by local assessors to be the total taxable value of land and additions on the property. | Land | Improvement |
|---|---|---|---|---|
| 2025 | $4,479 | $358,718 | $162,319 | $196,399 |
| 2024 | $4,479 | $351,686 | $159,137 | $192,549 |
| 2023 | $4,395 | $344,791 | $156,017 | $188,774 |
| 2022 | $4,194 | $338,031 | $152,958 | $185,073 |
| 2021 | $4,140 | $331,404 | $149,959 | $181,445 |
| 2019 | $4,019 | $321,576 | $145,512 | $176,064 |
| 2018 | $3,928 | $315,271 | $142,659 | $172,612 |
| 2016 | $3,748 | $303,030 | $137,120 | $165,910 |
| 2015 | $3,694 | $298,479 | $135,061 | $163,418 |
| 2014 | $3,714 | $292,633 | $132,416 | $160,217 |
Source: Public Records
Map
Nearby Homes
- 13247 Tripoli Ave
- 13197 Leach St
- 13372 Hyland Ct
- 13414 Herron St
- 13475 Hubbard St Unit 31
- 13166 Aztec St
- 13307 Herron St
- 13540 Hubbard St Unit 21
- 13567 Eldridge Ave
- 13095 Hubbard St Unit 1
- 12940 Harding St
- 13507 Raven St
- 13670 Garrick Ave
- 13631 Eldridge Ave
- 12888 Four Palms Ln
- 13912 N Mesa Alta Rd
- 13189 Herron St
- 13280 Raven St
- 13550 Foothill Blvd Unit 27
- 13260 Raven St
- 13294 Tripoli Ave
- 13278 Tripoli Ave
- 13298 Tripoli Ave
- 13274 Tripoli Ave
- 13325 Cranston Ave
- 13277 Tripoli Ave
- 13281 Tripoli Ave
- 13291 Tripoli Ave
- 13285 Tripoli Ave
- 13289 Tripoli Ave
- 13295 Tripoli Ave
- 13273 Tripoli Ave
- 13319 Cranston Ave
- 13299 Tripoli Ave
- 13270 Tripoli Ave
- 13269 Tripoli Ave
- 13313 Cranston Ave
- 13278 Kismet Ave
- 13250 Kismet Ave
- 13256 Kismet Ave