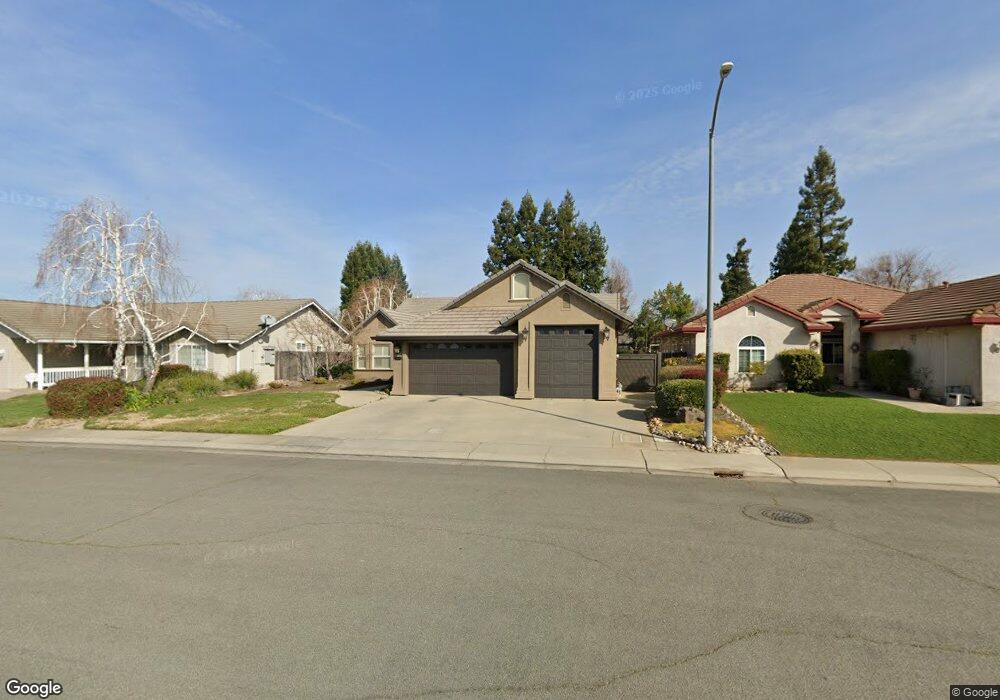
13291 E Lockeford Ranch Rd Lockeford, CA 95237
Estimated Value: $417,000 - $654,000
3
Beds
2
Baths
2,127
Sq Ft
$257/Sq Ft
Est. Value
About This Home
This home is located at 13291 E Lockeford Ranch Rd, Lockeford, CA 95237 and is currently estimated at $545,699, approximately $256 per square foot. 13291 E Lockeford Ranch Rd is a home located in San Joaquin County with nearby schools including Lockeford Elementary School, Lodi High School, and Point Quest Central Valley.
Ownership History
Date
Name
Owned For
Owner Type
Purchase Details
Closed on
Jul 2, 2007
Sold by
Dennis James M and Dennis Julia A
Bought by
Dennis James M and Dennis Julia A
Current Estimated Value
Purchase Details
Closed on
Feb 26, 2001
Sold by
Ford Carole A
Bought by
Dennis James M and Dennis Julia A
Home Financials for this Owner
Home Financials are based on the most recent Mortgage that was taken out on this home.
Original Mortgage
$175,000
Outstanding Balance
$64,199
Interest Rate
7.12%
Estimated Equity
$481,500
Purchase Details
Closed on
Jun 23, 1998
Sold by
Claudio Lavagnino
Bought by
Ford Donald F and Ford Carole A
Home Financials for this Owner
Home Financials are based on the most recent Mortgage that was taken out on this home.
Original Mortgage
$35,000
Interest Rate
7.17%
Mortgage Type
Seller Take Back
Create a Home Valuation Report for This Property
The Home Valuation Report is an in-depth analysis detailing your home's value as well as a comparison with similar homes in the area
Home Values in the Area
Average Home Value in this Area
Purchase History
| Date | Buyer | Sale Price | Title Company |
|---|---|---|---|
| Dennis James M | -- | None Available | |
| Dennis James M | -- | None Available | |
| Dennis James M | $240,000 | Alliance Title Company | |
| Ford Donald F | $210,000 | Alliance Title Company |
Source: Public Records
Mortgage History
| Date | Status | Borrower | Loan Amount |
|---|---|---|---|
| Open | Dennis James M | $175,000 | |
| Previous Owner | Ford Donald F | $35,000 |
Source: Public Records
Tax History Compared to Growth
Tax History
| Year | Tax Paid | Tax Assessment Tax Assessment Total Assessment is a certain percentage of the fair market value that is determined by local assessors to be the total taxable value of land and additions on the property. | Land | Improvement |
|---|---|---|---|---|
| 2025 | $4,191 | $361,616 | $108,483 | $253,133 |
| 2024 | $3,996 | $354,526 | $106,356 | $248,170 |
| 2023 | $3,937 | $347,575 | $104,271 | $243,304 |
| 2022 | $3,853 | $340,761 | $102,227 | $238,534 |
| 2021 | $3,919 | $334,080 | $100,223 | $233,857 |
| 2020 | $3,821 | $330,656 | $99,196 | $231,460 |
| 2019 | $3,747 | $324,173 | $97,251 | $226,922 |
| 2018 | $3,697 | $317,818 | $95,345 | $222,473 |
| 2017 | $3,617 | $311,587 | $93,476 | $218,111 |
| 2016 | $3,401 | $305,479 | $91,644 | $213,835 |
| 2014 | $3,322 | $295,001 | $88,500 | $206,501 |
Source: Public Records
Map
Nearby Homes
- 18385 Milford Dr
- 18450 N Highway 88 Unit 7A
- 12718 Locke Rd
- 14334 E Prospect Place
- 14370 E Prospect Place
- 11900 E Brandt Rd
- 14537 Miravista Ln
- 17251 N Tretheway Rd Unit 7
- 15155 N Curry Ave
- 6233 E Woodbridge Rd
- 15757 E Sargent Rd
- 19991 N Tretheway Rd
- 16795 N Manor Ln
- 21167 N Tretheway Rd
- 15296 N Highway 88
- 15330 Smith Rd
- 17010 N Locust Tree Rd
- 9403 Kirschenman Rd
- 15200 N Jory Rd
- 17490 N Bruella Rd
- 13313 E Lockeford Ranch Rd
- 13269 E Lockeford Ranch Rd
- 13335 E Lockeford Ranch Dr
- 13335 E Lockeford Ranch Rd
- 13296 Gina Dr
- 13308 Gina Dr
- 13200 Lockeford Rd
- 13278 E Lockeford Ranch Rd
- 13357 E Lockeford Ranch Rd
- 13320 Gina Dr
- 18382 N Abilene Way
- 13284 Gina Dr
- 18359 N Abilene Way
- 13332 Gina Dr
- 13379 E Lockeford Ranch Rd
- 18364 N Abilene Way
- 18433 Milford Dr
- 18449 Milford Dr
- 13299 Gina Dr
- 13311 Gina Dr