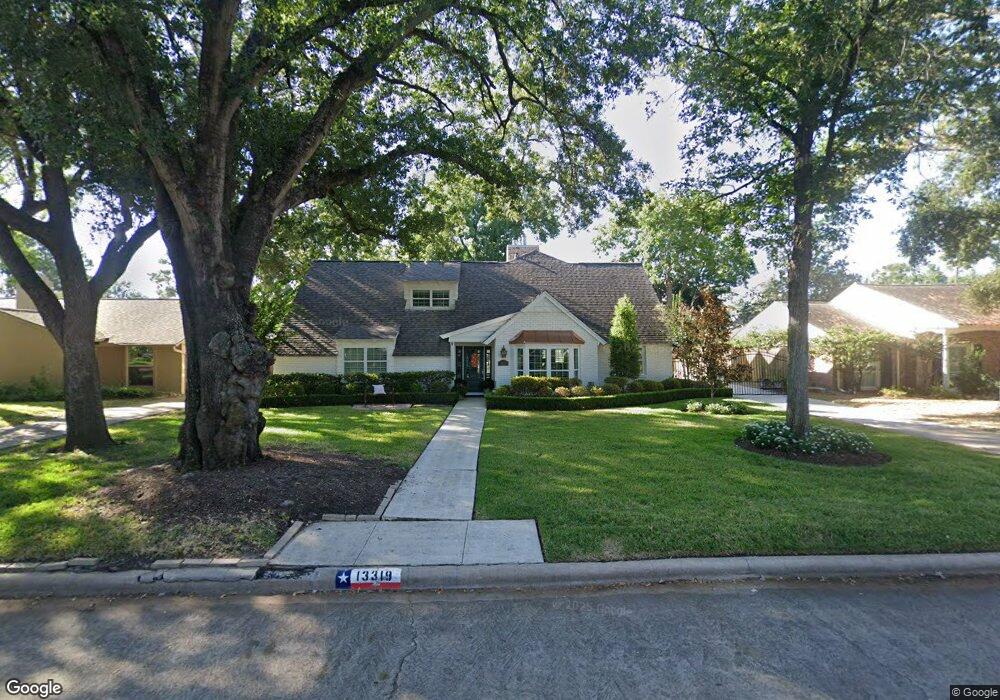
13319 Butterfly Ln Houston, TX 77079
Memorial NeighborhoodEstimated Value: $1,268,000 - $1,444,051
4
Beds
3
Baths
3,305
Sq Ft
$409/Sq Ft
Est. Value
About This Home
This home is located at 13319 Butterfly Ln, Houston, TX 77079 and is currently estimated at $1,352,513, approximately $409 per square foot. 13319 Butterfly Ln is a home located in Harris County with nearby schools including Rummel Creek Elementary School, Memorial Middle, and Stratford High School.
Ownership History
Date
Name
Owned For
Owner Type
Purchase Details
Closed on
Dec 7, 2019
Sold by
Shanklin Alison Legrand
Bought by
Shanklin Duncan
Current Estimated Value
Purchase Details
Closed on
Jul 21, 2011
Sold by
Le Grand Gregory Brent
Bought by
Shanklin Alison Rae
Purchase Details
Closed on
Jul 8, 2011
Sold by
Le Grand Richard Craig
Bought by
Shanklin Alison Rae
Purchase Details
Closed on
Jun 30, 2011
Sold by
Shanklin Alison Rae and Bragg Mark
Bought by
Shanklin Alison Rae and Le Grand Richard Craig
Purchase Details
Closed on
Nov 23, 2009
Sold by
Le Grand Marjorie and Le Grand Family Living Trust
Bought by
Le Grand Marjorie and Marjorie Le Grand Survivors Tr
Purchase Details
Closed on
Jan 30, 1995
Sold by
Legrand Richard V and Legrand Marjorie
Bought by
Legrand Richard and Legrand Marjorie
Create a Home Valuation Report for This Property
The Home Valuation Report is an in-depth analysis detailing your home's value as well as a comparison with similar homes in the area
Home Values in the Area
Average Home Value in this Area
Purchase History
| Date | Buyer | Sale Price | Title Company |
|---|---|---|---|
| Shanklin Duncan | -- | None Available | |
| Shanklin Alison Rae | -- | None Available | |
| Shanklin Alison Rae | -- | None Available | |
| Shanklin Alison Rae | -- | None Available | |
| Shanklin Alison Rae | -- | None Available | |
| Le Grand Marjorie | -- | None Available | |
| Legrand Richard | -- | -- |
Source: Public Records
Tax History Compared to Growth
Tax History
| Year | Tax Paid | Tax Assessment Tax Assessment Total Assessment is a certain percentage of the fair market value that is determined by local assessors to be the total taxable value of land and additions on the property. | Land | Improvement |
|---|---|---|---|---|
| 2025 | $13,158 | $1,474,050 | $587,760 | $886,290 |
| 2024 | $13,158 | $1,475,675 | $587,760 | $887,915 |
| 2023 | $12,061 | $1,195,483 | $587,760 | $607,723 |
| 2022 | $22,675 | $1,105,324 | $492,960 | $612,364 |
| 2021 | $21,527 | $881,721 | $474,000 | $407,721 |
| 2020 | $21,673 | $865,000 | $474,000 | $391,000 |
| 2019 | $22,467 | $858,165 | $474,000 | $384,165 |
| 2018 | $8,400 | $858,165 | $474,000 | $384,165 |
| 2017 | $22,450 | $858,165 | $474,000 | $384,165 |
| 2016 | $20,432 | $781,000 | $474,000 | $307,000 |
| 2015 | $15,020 | $781,000 | $474,000 | $307,000 |
| 2014 | $15,020 | $780,000 | $379,200 | $400,800 |
Source: Public Records
Map
Nearby Homes
- 13403 Taylorcrest Rd
- 334 Wycliffe Dr
- 414 E Gaywood Dr
- 807 Wycliffe Dr
- 13131 Kimberley Ln
- 710 Patchester Dr
- 807 Patchester Dr
- 903 Wycliffe Dr
- 839 Wax Myrtle Ln
- 866 Myrtlea Ln
- 921 Wax Myrtle Ln
- 893 Wax Myrtle Ln Unit 3
- 903 Wax Myrtle Ln
- 13004 Trail Hollow Dr Unit A
- 939 Wax Myrtle Ln
- 127 Gershwin Dr
- 210 Big Hollow Ln
- 12910 Traviata Dr
- 327 Electra Dr
- 12984 Trail Hollow Dr Unit 2984
- 13315 Butterfly Ln
- 13403 Butterfly Ln
- 13318 Tosca Ln
- 13402 Tosca Ln
- 13311 Butterfly Ln
- 13407 Butterfly Ln
- 13314 Tosca Ln
- 13406 Tosca Ln
- 13322 Butterfly Ln
- 13318 Butterfly Ln
- 13402 Butterfly Ln
- 13310 Tosca Ln
- 13314 Butterfly Ln
- 13307 Butterfly Ln
- 13411 Butterfly Ln
- 13410 Butterfly Ln
- 13414 Tosca Ln
- 13310 Butterfly Ln
- 13306 Tosca Ln
- 13319 Tosca Ln