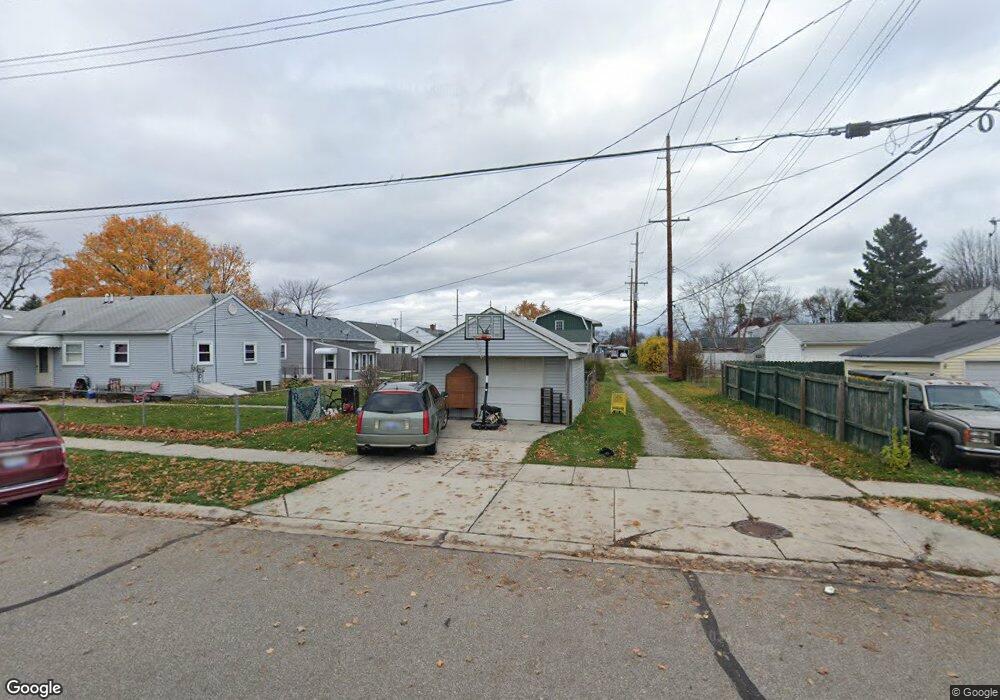
1332 23rd St Port Huron, MI 48060
Estimated Value: $124,000 - $167,000
3
Beds
1
Bath
972
Sq Ft
$144/Sq Ft
Est. Value
About This Home
This home is located at 1332 23rd St, Port Huron, MI 48060 and is currently estimated at $140,417, approximately $144 per square foot. 1332 23rd St is a home located in St. Clair County with nearby schools including Michigamme Elementary School, Central Middle School, and Port Huron High School.
Ownership History
Date
Name
Owned For
Owner Type
Purchase Details
Closed on
Mar 20, 2023
Sold by
Bills Charlene R
Bought by
Floyd D Bills And Charlene R Bills Revocable
Current Estimated Value
Purchase Details
Closed on
Feb 6, 2017
Sold by
Bills Floyd D and Bills Charlene R
Bought by
Bills Floyd D and Bills Charlene R
Purchase Details
Closed on
Nov 1, 2016
Sold by
Bills Floyd D and Bills Charlene R
Bought by
Bills Floyd D and Bills Charlene R
Purchase Details
Closed on
Oct 30, 2009
Sold by
Fulcher Inez J
Bought by
Bills Floyd and Bills Charlene
Create a Home Valuation Report for This Property
The Home Valuation Report is an in-depth analysis detailing your home's value as well as a comparison with similar homes in the area
Home Values in the Area
Average Home Value in this Area
Purchase History
| Date | Buyer | Sale Price | Title Company |
|---|---|---|---|
| Floyd D Bills And Charlene R Bills Revocable | -- | -- | |
| Bills Floyd D | -- | None Available | |
| Bills Floyd D | -- | None Available | |
| Bills Floyd | $32,000 | Sky Title Agency |
Source: Public Records
Tax History Compared to Growth
Tax History
| Year | Tax Paid | Tax Assessment Tax Assessment Total Assessment is a certain percentage of the fair market value that is determined by local assessors to be the total taxable value of land and additions on the property. | Land | Improvement |
|---|---|---|---|---|
| 2025 | $1,357 | $54,500 | $0 | $0 |
| 2024 | $1,061 | $53,000 | $0 | $0 |
| 2023 | $1,114 | $48,200 | $0 | $0 |
| 2022 | $1,387 | $42,400 | $0 | $0 |
| 2021 | $1,325 | $38,800 | $0 | $0 |
| 2020 | $1,330 | $35,500 | $35,500 | $0 |
| 2019 | $1,306 | $25,600 | $0 | $0 |
| 2018 | $1,277 | $25,600 | $0 | $0 |
| 2017 | $1,173 | $22,100 | $0 | $0 |
| 2016 | $1,037 | $22,100 | $0 | $0 |
| 2015 | $1,018 | $20,000 | $20,000 | $0 |
| 2014 | $1,018 | $18,900 | $18,900 | $0 |
| 2013 | -- | $19,000 | $0 | $0 |
Source: Public Records
Map
Nearby Homes