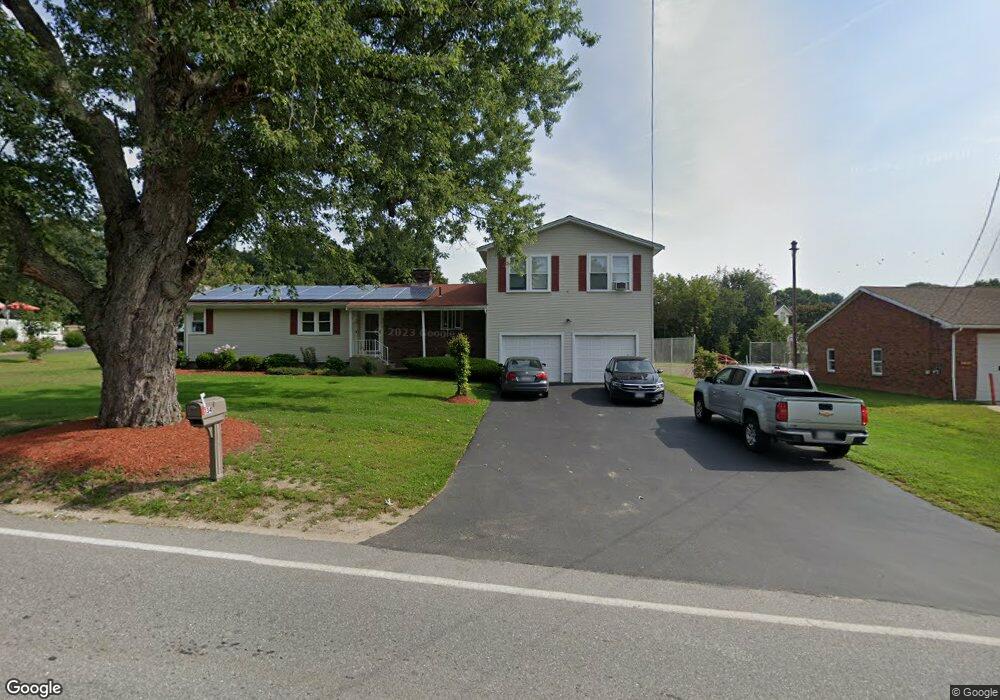
134 Elm St Blackstone, MA 01504
Estimated Value: $540,000 - $682,000
5
Beds
4
Baths
2,262
Sq Ft
$275/Sq Ft
Est. Value
About This Home
This home is located at 134 Elm St, Blackstone, MA 01504 and is currently estimated at $621,051, approximately $274 per square foot. 134 Elm St is a home located in Worcester County with nearby schools including Blackstone-Millville Regional High School, Rise Prep Mayoral Academy Middle School, and Rise Prep Mayoral Academy.
Ownership History
Date
Name
Owned For
Owner Type
Purchase Details
Closed on
Aug 19, 2016
Sold by
Allen Sandra A and Allen Richard T
Bought by
Allen Jeffrey J
Current Estimated Value
Home Financials for this Owner
Home Financials are based on the most recent Mortgage that was taken out on this home.
Original Mortgage
$120,000
Outstanding Balance
$74,954
Interest Rate
3.41%
Mortgage Type
Commercial
Estimated Equity
$546,097
Create a Home Valuation Report for This Property
The Home Valuation Report is an in-depth analysis detailing your home's value as well as a comparison with similar homes in the area
Home Values in the Area
Average Home Value in this Area
Purchase History
| Date | Buyer | Sale Price | Title Company |
|---|---|---|---|
| Allen Jeffrey J | -- | -- | |
| Allen Jeffrey J | -- | -- |
Source: Public Records
Mortgage History
| Date | Status | Borrower | Loan Amount |
|---|---|---|---|
| Open | Allen Jeffrey J | $120,000 | |
| Closed | Allen Jeffrey J | $120,000 |
Source: Public Records
Tax History Compared to Growth
Tax History
| Year | Tax Paid | Tax Assessment Tax Assessment Total Assessment is a certain percentage of the fair market value that is determined by local assessors to be the total taxable value of land and additions on the property. | Land | Improvement |
|---|---|---|---|---|
| 2025 | $6,889 | $456,200 | $155,400 | $300,800 |
| 2024 | $7,089 | $434,100 | $146,800 | $287,300 |
| 2023 | $6,658 | $411,500 | $146,800 | $264,700 |
| 2022 | $6,705 | $374,600 | $133,700 | $240,900 |
| 2021 | $6,269 | $334,900 | $121,600 | $213,300 |
| 2020 | $6,629 | $351,500 | $121,600 | $229,900 |
| 2019 | $6,329 | $334,700 | $111,800 | $222,900 |
| 2018 | $104 | $283,500 | $106,400 | $177,100 |
| 2017 | $6,213 | $284,600 | $106,400 | $178,200 |
| 2016 | $5,303 | $281,400 | $98,700 | $182,700 |
| 2015 | $5,096 | $261,600 | $98,700 | $162,900 |
Source: Public Records
Map
Nearby Homes
- 160 Federal St
- Lot 1 Pickering Rd
- Lot 5 Pickering Rd
- Lot 2 Pickering Rd
- Lot 4 Pickering Rd
- Lot 3 Pickering Rd
- 49R Elm St
- 227 Blackstone St
- 1, 3, 5 Old Lincoln St
- 162 Blackstone St
- 15 Fox Run Rd Unit 15
- 62 Laurel Ln
- 25 Milk St
- 361 S Main St
- 4 Little Tree Ln
- 57 Milk St
- 70 Oswego St
- 36 Indian Run Rd
- 60 Freeman St
- 41 Mansion St