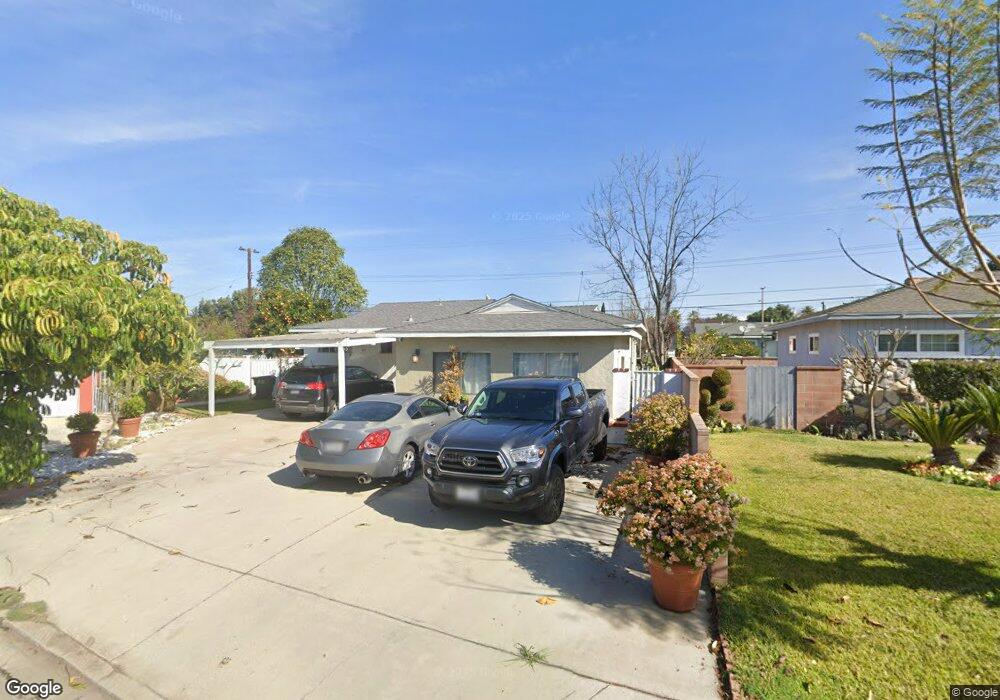
13435 Lassalette St La Puente, CA 91746
West Puente Valley NeighborhoodEstimated Value: $710,000 - $764,000
3
Beds
2
Baths
1,561
Sq Ft
$477/Sq Ft
Est. Value
About This Home
This home is located at 13435 Lassalette St, La Puente, CA 91746 and is currently estimated at $744,256, approximately $476 per square foot. 13435 Lassalette St is a home located in Los Angeles County with nearby schools including J.E. Van Wig Elementary School, Torch Middle School, and Bassett Senior High School.
Ownership History
Date
Name
Owned For
Owner Type
Purchase Details
Closed on
Nov 21, 2001
Sold by
Hermitage Investment
Bought by
Platas Roman and Platas Araceli
Current Estimated Value
Home Financials for this Owner
Home Financials are based on the most recent Mortgage that was taken out on this home.
Original Mortgage
$182,141
Outstanding Balance
$70,717
Interest Rate
6.63%
Mortgage Type
FHA
Estimated Equity
$673,539
Purchase Details
Closed on
Jun 14, 2001
Sold by
Lerma Secundino and Lerma Vicente
Bought by
Hermitage Investments Llc
Purchase Details
Closed on
Jan 10, 1995
Sold by
Villarreal Clemencia H
Bought by
Lerma Secundino and Lerma Vicenta
Home Financials for this Owner
Home Financials are based on the most recent Mortgage that was taken out on this home.
Original Mortgage
$110,250
Interest Rate
9.23%
Create a Home Valuation Report for This Property
The Home Valuation Report is an in-depth analysis detailing your home's value as well as a comparison with similar homes in the area
Home Values in the Area
Average Home Value in this Area
Purchase History
| Date | Buyer | Sale Price | Title Company |
|---|---|---|---|
| Platas Roman | $185,000 | Fidelity National Title Ins | |
| Hermitage Investment | $92,300 | Fidelity National Title Ins | |
| Hermitage Investments Llc | $138,400 | -- | |
| Lerma Secundino | $147,000 | Gateway Title Company |
Source: Public Records
Mortgage History
| Date | Status | Borrower | Loan Amount |
|---|---|---|---|
| Open | Platas Roman | $182,141 | |
| Previous Owner | Lerma Secundino | $110,250 | |
| Closed | Lerma Secundino | $29,400 |
Source: Public Records
Tax History Compared to Growth
Tax History
| Year | Tax Paid | Tax Assessment Tax Assessment Total Assessment is a certain percentage of the fair market value that is determined by local assessors to be the total taxable value of land and additions on the property. | Land | Improvement |
|---|---|---|---|---|
| 2025 | $3,816 | $273,280 | $172,835 | $100,445 |
| 2024 | $3,816 | $267,923 | $169,447 | $98,476 |
| 2023 | $3,703 | $262,671 | $166,125 | $96,546 |
| 2022 | $3,549 | $257,521 | $162,868 | $94,653 |
| 2021 | $3,480 | $252,473 | $159,675 | $92,798 |
| 2019 | $3,395 | $244,987 | $154,940 | $90,047 |
| 2018 | $3,248 | $240,184 | $151,902 | $88,282 |
| 2016 | $3,111 | $230,858 | $146,004 | $84,854 |
| 2015 | $3,036 | $227,391 | $143,811 | $83,580 |
| 2014 | $2,898 | $222,937 | $140,994 | $81,943 |
Source: Public Records
Map
Nearby Homes
- 720 Le Borgne Ave
- 13426 Austen Way
- 13622 Hartsville St
- 915 Stichman Ave
- 1003 Le Borgne Ave
- 13903 Moccasin St
- 610 Willow Ave
- 452 Willow Ave
- 335 Willow Ave
- 13540 Valley Blvd
- 979 Willow Ave Unit 31
- 943 Willow Ave
- 208 S 2nd Ave
- 433 Sunkist Ave
- 765 Frazier St
- 12828 Hensel St
- 12822 Hensel St
- 234 S Covina Blvd
- 14104 Barrydale St
- 13120 Dart St Unit E
- 13441 Lassalette St
- 13431 Lassalette St
- 13434 Hutchcroft St
- 13430 Hutchcroft St
- 13447 Lassalette St
- 13428 Lassalette St
- 13446 Hutchcroft St
- 13432 Lassalette St
- 13440 Lassalette St
- 13453 Lassalette St
- 13431 Hutchcroft St
- 632 Vineland Ave
- 638 Vineland Ave
- 13446 Lassalette St
- 13452 Hutchcroft St
- 646 Vineland Ave
- 628 Vineland Ave
- 13437 Hutchcroft St
- 13435 Hutchcroft St
- 652 Vineland Ave