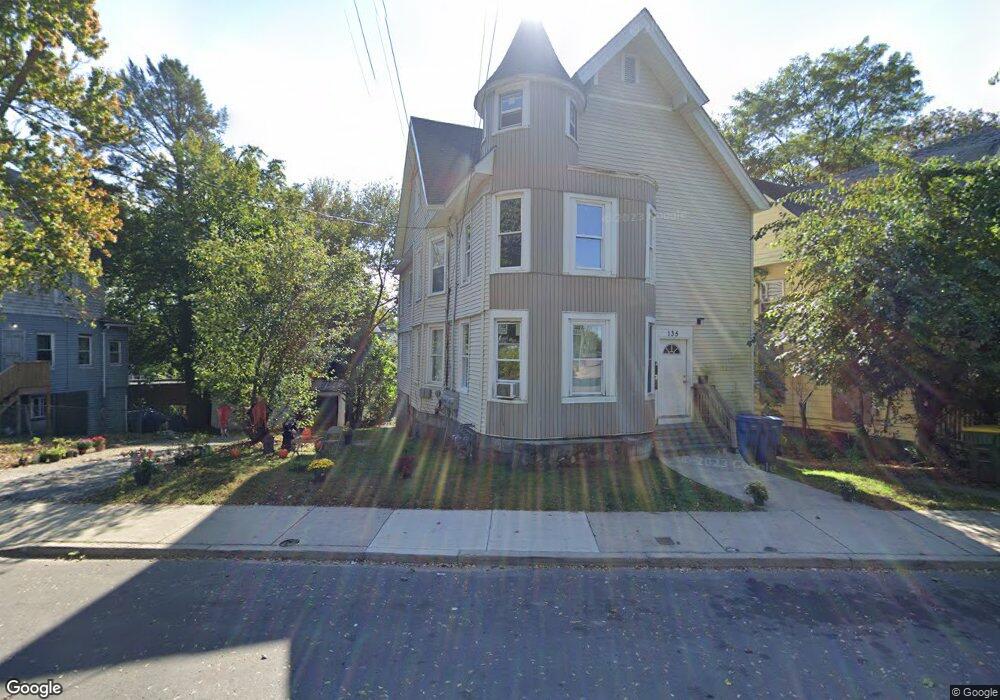
135 Waterville St Waterbury, CT 06710
Village of Waterbury NeighborhoodEstimated Value: $250,904 - $382,000
8
Beds
3
Baths
3,198
Sq Ft
$100/Sq Ft
Est. Value
About This Home
This home is located at 135 Waterville St, Waterbury, CT 06710 and is currently estimated at $320,226, approximately $100 per square foot. 135 Waterville St is a home located in New Haven County with nearby schools including North End Middle School, Wilby High School, and Brass City Charter School.
Ownership History
Date
Name
Owned For
Owner Type
Purchase Details
Closed on
Aug 2, 2013
Sold by
Us Bank Na Tr
Bought by
Mutual Housing Assn
Current Estimated Value
Purchase Details
Closed on
Nov 19, 2012
Sold by
Hatak Servicing Llc and Us Bank Na
Bought by
Us Bank Na
Purchase Details
Closed on
Mar 22, 2005
Sold by
Vazquez Roberto
Bought by
Dym Steven
Home Financials for this Owner
Home Financials are based on the most recent Mortgage that was taken out on this home.
Original Mortgage
$112,500
Interest Rate
5.64%
Mortgage Type
Purchase Money Mortgage
Purchase Details
Closed on
Jun 7, 1995
Sold by
Brown Ent
Bought by
Vazquez Roberto
Home Financials for this Owner
Home Financials are based on the most recent Mortgage that was taken out on this home.
Original Mortgage
$84,867
Interest Rate
8.21%
Mortgage Type
Purchase Money Mortgage
Purchase Details
Closed on
Jan 25, 1989
Sold by
Desomma Anthony
Bought by
Samela Joseph W
Create a Home Valuation Report for This Property
The Home Valuation Report is an in-depth analysis detailing your home's value as well as a comparison with similar homes in the area
Home Values in the Area
Average Home Value in this Area
Purchase History
| Date | Buyer | Sale Price | Title Company |
|---|---|---|---|
| Mutual Housing Assn | -- | -- | |
| Us Bank Na | $150,000 | -- | |
| Dym Steven | $150,000 | -- | |
| Vazquez Roberto | $85,000 | -- | |
| Samela Joseph W | $152,000 | -- |
Source: Public Records
Mortgage History
| Date | Status | Borrower | Loan Amount |
|---|---|---|---|
| Previous Owner | Samela Joseph W | $112,500 | |
| Previous Owner | Samela Joseph W | $22,500 | |
| Previous Owner | Samela Joseph W | $84,867 |
Source: Public Records
Tax History Compared to Growth
Tax History
| Year | Tax Paid | Tax Assessment Tax Assessment Total Assessment is a certain percentage of the fair market value that is determined by local assessors to be the total taxable value of land and additions on the property. | Land | Improvement |
|---|---|---|---|---|
| 2025 | $3,196 | $71,050 | $8,680 | $62,370 |
| 2024 | $3,513 | $71,050 | $8,680 | $62,370 |
| 2023 | $3,850 | $71,050 | $8,680 | $62,370 |
| 2022 | $1,789 | $29,710 | $8,680 | $21,030 |
| 2021 | $1,789 | $29,710 | $8,680 | $21,030 |
| 2020 | $1,789 | $29,710 | $8,680 | $21,030 |
| 2019 | $1,789 | $29,710 | $8,680 | $21,030 |
| 2018 | $1,789 | $29,710 | $8,680 | $21,030 |
| 2017 | $1,776 | $29,490 | $8,680 | $20,810 |
| 2016 | $1,845 | $30,640 | $8,680 | $21,960 |
| 2015 | $1,784 | $30,640 | $8,680 | $21,960 |
| 2014 | $1,784 | $30,640 | $8,680 | $21,960 |
Source: Public Records
Map
Nearby Homes
- 57 Ridgewood St
- 232 Hillside Ave
- 26 Ridgewood St
- 271 Willow St
- 50 Chestnut Ave
- 133 Willow St
- 37 Plaza Ave
- 152 Lincoln St Unit 19
- 184 Buckingham St
- 181 Buckingham St
- 38 Kellogg St
- 4 Ann St
- 28 Gilbert St
- 18 Pine St
- 65 Cables Ave Unit 21
- 90 Pine St
- 96 Hillside Ave
- 81 Clowes Terrace
- 67 Holmes Ave
- 70 Hillside Ave
- 139 Waterville St
- 145 Waterville St
- 121 Waterville St
- 141 Waterville St
- 141 Waterville St Unit SREET
- 141 Waterville St Unit 2
- 147 Waterville St
- 143 Waterville St
- 149 Waterville St
- 109 Waterville St
- 78 Fairview St
- 149 Waterville St
- 150 Waterville St
- 153 Waterville St
- 82 Fairview St
- 101 Waterville St
- 76 Fairview St
- 155 Waterville St
- 96 Ridgewood St
- 98 Fairview St Unit 1