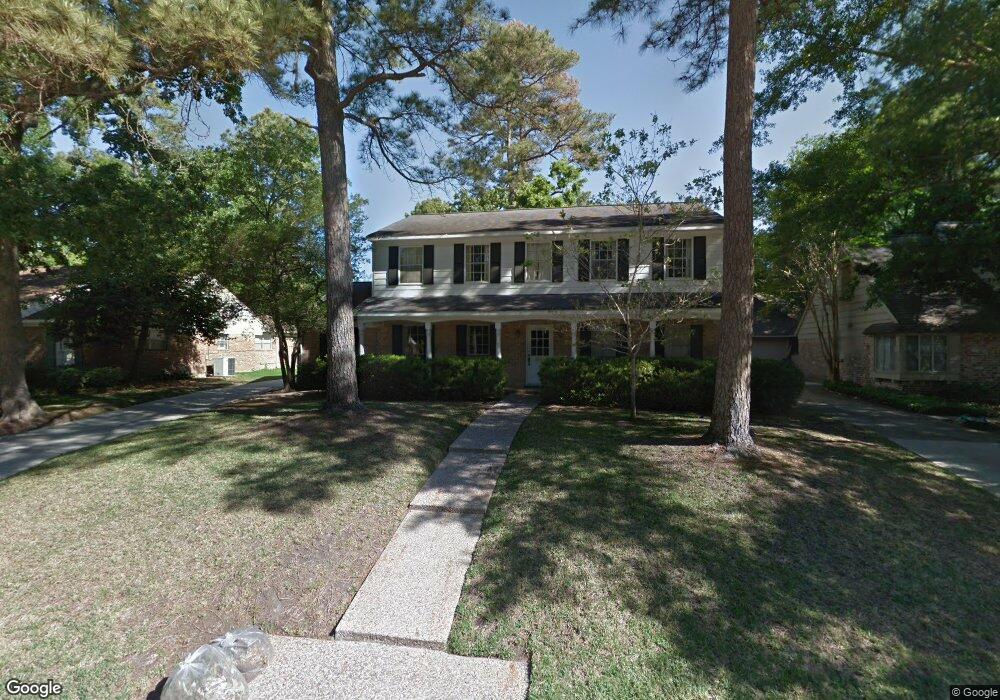
13514 Queensbury Ln Houston, TX 77079
Memorial NeighborhoodEstimated Value: $931,177 - $1,109,000
5
Beds
4
Baths
2,986
Sq Ft
$340/Sq Ft
Est. Value
About This Home
This home is located at 13514 Queensbury Ln, Houston, TX 77079 and is currently estimated at $1,014,794, approximately $339 per square foot. 13514 Queensbury Ln is a home located in Harris County with nearby schools including Wilchester Elementary School, Memorial Middle, and Stratford High School.
Ownership History
Date
Name
Owned For
Owner Type
Purchase Details
Closed on
Feb 12, 2021
Sold by
Chill Mary Joan
Bought by
Ross David William and Ross Kelly L
Current Estimated Value
Home Financials for this Owner
Home Financials are based on the most recent Mortgage that was taken out on this home.
Original Mortgage
$510,000
Outstanding Balance
$454,695
Interest Rate
2.65%
Mortgage Type
New Conventional
Estimated Equity
$560,099
Purchase Details
Closed on
Feb 11, 2021
Sold by
Cahill Mary Joan
Bought by
Ross David William and Ross Kelly L
Home Financials for this Owner
Home Financials are based on the most recent Mortgage that was taken out on this home.
Original Mortgage
$510,000
Outstanding Balance
$454,695
Interest Rate
2.65%
Mortgage Type
New Conventional
Estimated Equity
$560,099
Purchase Details
Closed on
Jun 19, 2018
Sold by
Cahill Mary Joan and Cahill Joseph M
Bought by
Cahill Mary Joan
Create a Home Valuation Report for This Property
The Home Valuation Report is an in-depth analysis detailing your home's value as well as a comparison with similar homes in the area
Home Values in the Area
Average Home Value in this Area
Purchase History
| Date | Buyer | Sale Price | Title Company |
|---|---|---|---|
| Ross David William | -- | Chicago Title Company | |
| Ross David William | -- | Chicago Title Company | |
| Ross David William | -- | Chicago Title | |
| Cahill Mary Joan | -- | None Available |
Source: Public Records
Mortgage History
| Date | Status | Borrower | Loan Amount |
|---|---|---|---|
| Open | Ross David William | $510,000 | |
| Closed | Ross David William | $510,000 | |
| Closed | Ross David William | $510,000 |
Source: Public Records
Tax History Compared to Growth
Tax History
| Year | Tax Paid | Tax Assessment Tax Assessment Total Assessment is a certain percentage of the fair market value that is determined by local assessors to be the total taxable value of land and additions on the property. | Land | Improvement |
|---|---|---|---|---|
| 2025 | $10,734 | $622,195 | $440,310 | $181,885 |
| 2024 | $10,734 | $669,732 | $440,310 | $229,422 |
| 2023 | $10,734 | $716,871 | $440,310 | $276,561 |
| 2022 | $15,126 | $647,000 | $418,295 | $228,705 |
| 2021 | $13,555 | $555,190 | $403,618 | $151,572 |
| 2020 | $13,966 | $557,378 | $403,618 | $153,760 |
| 2019 | $14,489 | $553,439 | $403,618 | $149,821 |
| 2018 | $3,459 | $553,439 | $403,618 | $149,821 |
| 2017 | $13,607 | $553,439 | $403,618 | $149,821 |
| 2016 | $12,370 | $553,439 | $403,618 | $149,821 |
| 2015 | $3,721 | $553,439 | $403,618 | $149,821 |
| 2014 | $3,721 | $459,319 | $278,863 | $180,456 |
Source: Public Records
Map
Nearby Homes
- 807 Wycliffe Dr
- 710 Patchester Dr
- 903 Wycliffe Dr
- 13403 Taylorcrest Rd
- 807 Patchester Dr
- 13131 Kimberley Ln
- 866 Myrtlea Ln
- 13931 Kingsride Ln
- 1110 W Tri Oaks Ln Unit 157
- 11102 Savannah Oaks Ln
- 881 Wax Myrtle Ln Unit A
- 1108 W Tri Oaks Ln Unit 150
- 11411 Ash Creek Dr
- 939 Wax Myrtle Ln
- 1113 Sherwood Trail
- 921 Wax Myrtle Ln
- 839 Wax Myrtle Ln
- 1129 Sherwood Run
- 11402 Ash Creek Dr
- 903 Wax Myrtle Ln
- 13510 Queensbury Ln
- 13518 Queensbury Ln
- 13515 Barryknoll Ln
- 13511 Barryknoll Ln
- 13519 Barryknoll Ln
- 13506 Queensbury Ln
- 13515 Queensbury Ln
- 13511 Queensbury Ln
- 13519 Queensbury Ln
- 13507 Barryknoll Ln
- 13502 Queensbury Ln
- 13507 Queensbury Ln
- 819 Glenchester Dr
- 819 Glenchester St
- 823 Glenchester St
- 815 Glenchester St
- 13503 Barryknoll Ln
- 827 Glenchester St
- 13514 Pinerock Ln
- 13514 Barryknoll Ln