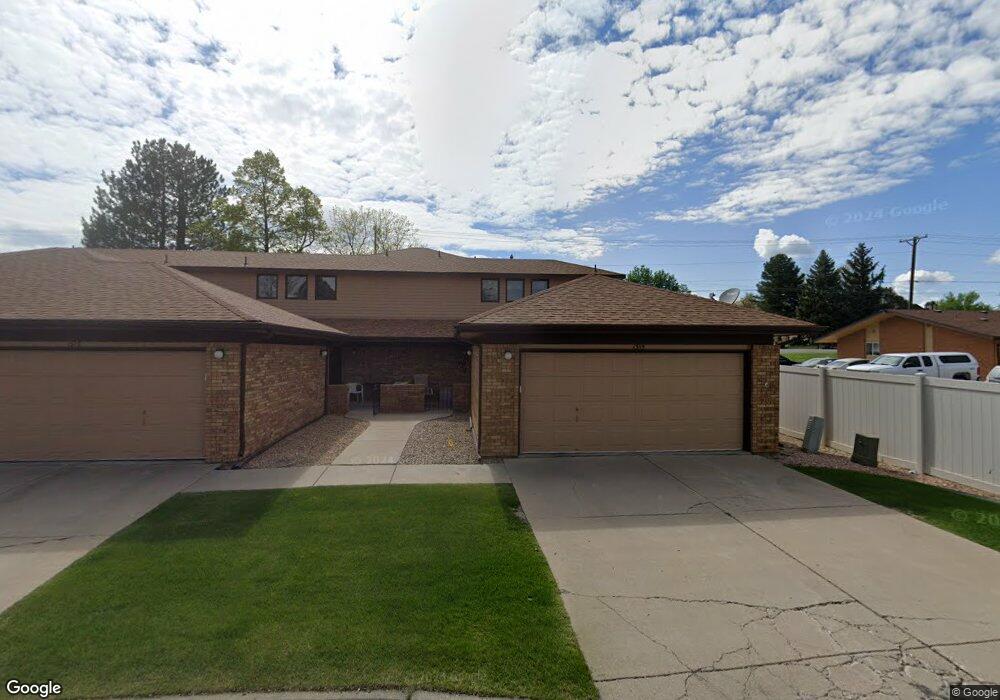
1355 Aspen Place Unit F3 Loveland, CO 80538
Estimated Value: $389,588 - $426,000
2
Beds
2
Baths
1,543
Sq Ft
$266/Sq Ft
Est. Value
About This Home
This home is located at 1355 Aspen Place Unit F3, Loveland, CO 80538 and is currently estimated at $410,647, approximately $266 per square foot. 1355 Aspen Place Unit F3 is a home located in Larimer County with nearby schools including Lincoln Elementary School, Lucile Erwin Middle School, and Loveland High School.
Ownership History
Date
Name
Owned For
Owner Type
Purchase Details
Closed on
Dec 23, 2020
Sold by
Bradford David L and Bradford Marriem A
Bought by
Bradford Marriem A
Current Estimated Value
Purchase Details
Closed on
Dec 6, 2016
Sold by
Bradford Marriem A
Bought by
Bradford David L and Bradford Marriem A
Purchase Details
Closed on
Sep 14, 2016
Sold by
Russell Louise
Bought by
Bradford Marriem A
Purchase Details
Closed on
Sep 20, 2013
Sold by
Brunmeier Donetta Kay
Bought by
Russell Louise
Home Financials for this Owner
Home Financials are based on the most recent Mortgage that was taken out on this home.
Original Mortgage
$86,000
Interest Rate
3.51%
Mortgage Type
New Conventional
Purchase Details
Closed on
Apr 4, 2001
Sold by
Inter Vivos Trust and Caswell Dorothy Dee
Bought by
Brunmeier Calvin and Brunmeier Donetta Kay
Purchase Details
Closed on
Nov 1, 1993
Sold by
Caswell Dorothy D
Bought by
Caswell Dorothy Dee Inter Vivos Trust
Create a Home Valuation Report for This Property
The Home Valuation Report is an in-depth analysis detailing your home's value as well as a comparison with similar homes in the area
Home Values in the Area
Average Home Value in this Area
Purchase History
| Date | Buyer | Sale Price | Title Company |
|---|---|---|---|
| Bradford Marriem A | -- | None Listed On Document | |
| Bradford David L | -- | None Available | |
| Bradford Marriem A | $235,000 | Stewart Title | |
| Russell Louise | $186,000 | Guardian Title | |
| Brunmeier Calvin | $162,000 | Security Title | |
| Caswell Dorothy Dee Inter Vivos Trust | -- | -- |
Source: Public Records
Mortgage History
| Date | Status | Borrower | Loan Amount |
|---|---|---|---|
| Previous Owner | Russell Louise | $86,000 |
Source: Public Records
Tax History Compared to Growth
Tax History
| Year | Tax Paid | Tax Assessment Tax Assessment Total Assessment is a certain percentage of the fair market value that is determined by local assessors to be the total taxable value of land and additions on the property. | Land | Improvement |
|---|---|---|---|---|
| 2025 | $1,797 | $26,204 | $3,015 | $23,189 |
| 2024 | $1,733 | $26,204 | $3,015 | $23,189 |
| 2022 | $1,652 | $20,767 | $3,128 | $17,639 |
| 2021 | $1,698 | $21,365 | $3,218 | $18,147 |
| 2020 | $1,637 | $20,593 | $3,218 | $17,375 |
| 2019 | $1,610 | $20,593 | $3,218 | $17,375 |
| 2018 | $1,454 | $17,662 | $3,240 | $14,422 |
| 2017 | $1,252 | $17,662 | $3,240 | $14,422 |
| 2016 | $1,143 | $15,578 | $3,582 | $11,996 |
| 2015 | $1,133 | $15,580 | $3,580 | $12,000 |
| 2014 | $1,141 | $15,170 | $3,580 | $11,590 |
Source: Public Records
Map
Nearby Homes
- 2922 Alamosa Ct
- 1463 Caddoa Dr
- 1534 W 28th St
- 3621 Adena Ct
- 1428 W 25th St
- 2468 Chama Ct
- 3210 N Colorado Ave
- 706 W 29th St
- 957 Logan Ct
- 2894 Empire Ave
- 3312 N Colorado Ave
- 2306 Cameo Ave
- 3110 N Franklin Ave
- 717 W 36th St
- 1440 W 40th St
- 3620 N Colorado Ave
- 3679 Wild Horse Ct Unit 3679
- 1805 W 22nd St
- 2503 N Estrella Ave
- 3321 Butternut Dr
- 1355 Aspen Place Unit 3
- 1373 Aspen Place Unit F2
- 1397 Aspen Place
- 1315 Aspen Place
- 1339 Aspen Place Unit E2
- 1402 W 31st St
- 1251 Aspen Place Unit D1
- 1406 W 31st St
- 1263 Aspen Place
- 1275 Aspen Place
- 1275 Aspen Place Unit 3
- 1401 W 31st St
- 1287 Aspen Place
- 1299 Aspen Place
- 1410 W 31st St
- 1403 W 31st St
- 1 Aspen Dr Unit E
- 1 Aspen Dr Unit V
- 1 Aspen Dr Unit S
- 1 Aspen Dr Unit O