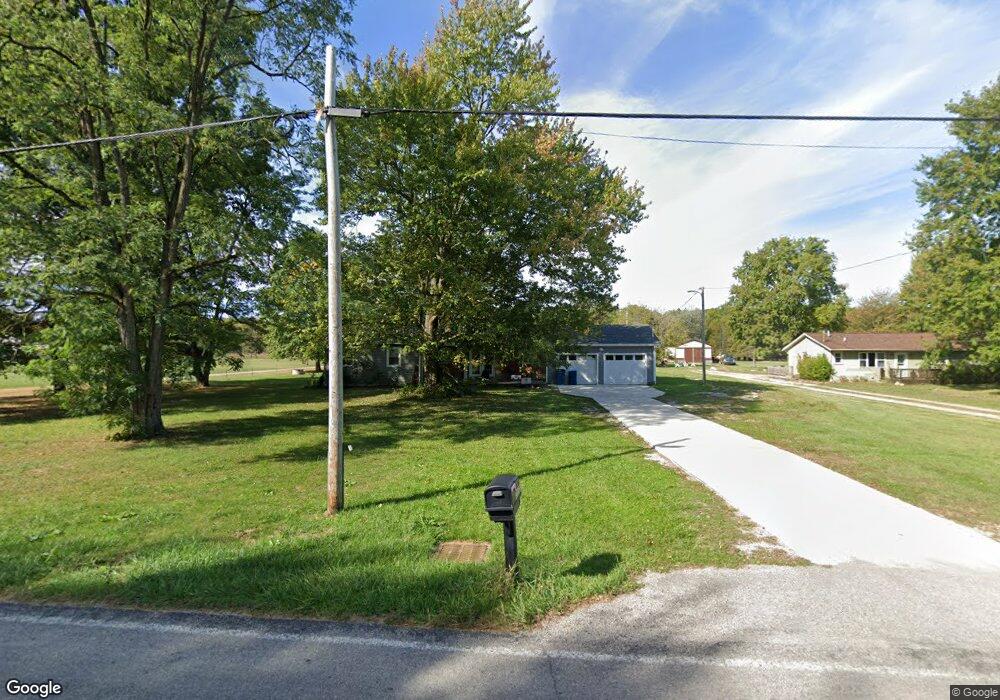
13552 Hale Rd Oberlin, OH 44074
Estimated Value: $286,000 - $343,000
3
Beds
2
Baths
1,940
Sq Ft
$158/Sq Ft
Est. Value
About This Home
This home is located at 13552 Hale Rd, Oberlin, OH 44074 and is currently estimated at $307,439, approximately $158 per square foot. 13552 Hale Rd is a home located in Lorain County with nearby schools including Oberlin Elementary School, Prospect Elementary School, and Langston Middle School.
Ownership History
Date
Name
Owned For
Owner Type
Purchase Details
Closed on
Apr 23, 2025
Sold by
914 Oliver Llc
Bought by
Jj Lorain Homes Llc
Current Estimated Value
Home Financials for this Owner
Home Financials are based on the most recent Mortgage that was taken out on this home.
Original Mortgage
$2,962,000
Outstanding Balance
$2,948,903
Interest Rate
6.67%
Mortgage Type
New Conventional
Estimated Equity
-$2,641,464
Purchase Details
Closed on
Mar 6, 2024
Sold by
J And J Enterprise Llc
Bought by
914 Oliver Llc
Purchase Details
Closed on
Sep 1, 2023
Sold by
Sheriff Of Lorain County Ohio
Bought by
J & J Enterprise Llc
Purchase Details
Closed on
Feb 29, 2008
Sold by
Fannie Mae
Bought by
Ingold James
Purchase Details
Closed on
Aug 11, 2006
Sold by
Brooks Thomas D and Mortgage Electronic Registrati
Bought by
Federal National Mortgage Association
Create a Home Valuation Report for This Property
The Home Valuation Report is an in-depth analysis detailing your home's value as well as a comparison with similar homes in the area
Home Values in the Area
Average Home Value in this Area
Purchase History
| Date | Buyer | Sale Price | Title Company |
|---|---|---|---|
| Jj Lorain Homes Llc | -- | Miller Home Title | |
| 914 Oliver Llc | -- | None Listed On Document | |
| J & J Enterprise Llc | $96,400 | None Listed On Document | |
| Ingold James | $58,000 | Phoenix Title Agency | |
| Federal National Mortgage Association | $96,000 | None Available |
Source: Public Records
Mortgage History
| Date | Status | Borrower | Loan Amount |
|---|---|---|---|
| Open | Jj Lorain Homes Llc | $2,962,000 |
Source: Public Records
Tax History Compared to Growth
Tax History
| Year | Tax Paid | Tax Assessment Tax Assessment Total Assessment is a certain percentage of the fair market value that is determined by local assessors to be the total taxable value of land and additions on the property. | Land | Improvement |
|---|---|---|---|---|
| 2024 | $3,535 | $78,586 | $15,617 | $62,969 |
| 2023 | $3,302 | $67,631 | $15,211 | $52,420 |
| 2022 | $3,201 | $67,631 | $15,211 | $52,420 |
| 2021 | $3,197 | $67,631 | $15,211 | $52,420 |
| 2020 | $2,888 | $57,360 | $12,900 | $44,460 |
| 2019 | $2,861 | $57,360 | $12,900 | $44,460 |
| 2018 | $2,885 | $57,360 | $12,900 | $44,460 |
| 2017 | $2,488 | $50,170 | $12,580 | $37,590 |
| 2016 | $2,514 | $50,170 | $12,580 | $37,590 |
| 2015 | $2,516 | $50,170 | $12,580 | $37,590 |
| 2014 | $2,622 | $51,450 | $12,900 | $38,550 |
| 2013 | $2,572 | $51,450 | $12,900 | $38,550 |
Source: Public Records
Map
Nearby Homes
- 44867 E Hamilton St
- 248 Shipherd Cir
- 187 Shipherd Cir
- 152 Shipherd Cir
- 95 Shipherd Cir
- 110 Shipherd Cir
- 41635 Parsons Rd
- 12380 Oberlin Rd
- 182 E Hamilton St
- 118 Locust St
- 126 N Park St
- 62 Locust St
- 59 E Vine St
- 296 S Pleasant St
- 111 N Pleasant St
- 14409 State Route 58
- 216 N Main St
- 89 S Professor St
- 123 S Professor St
- 81 S Professor St