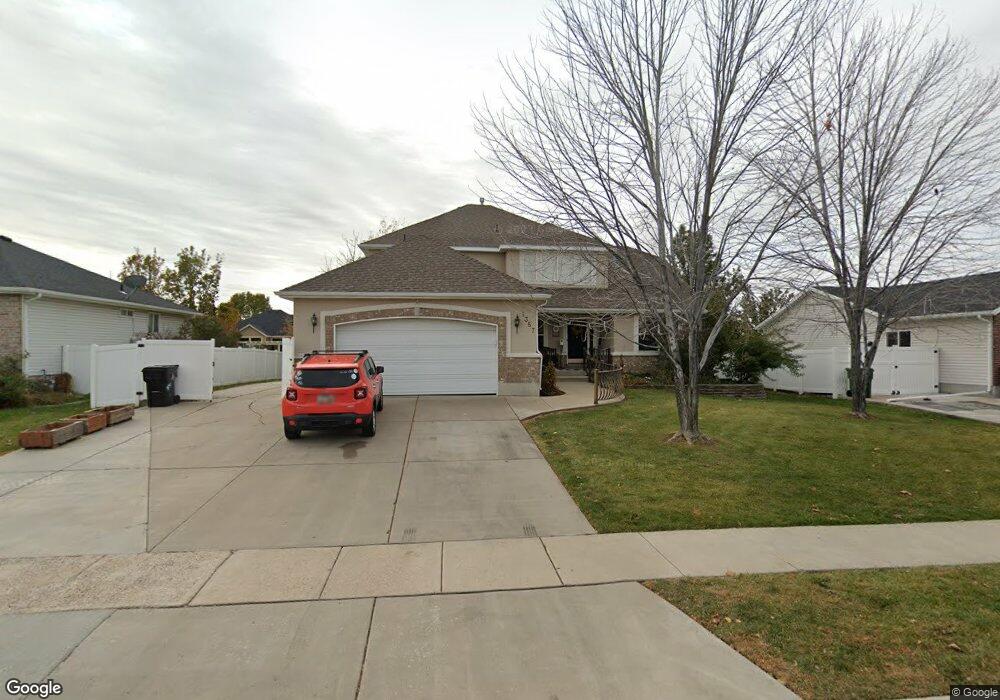
1357 W 2375 S Syracuse, UT 84075
Estimated Value: $653,000 - $717,000
6
Beds
4
Baths
4,025
Sq Ft
$171/Sq Ft
Est. Value
About This Home
This home is located at 1357 W 2375 S, Syracuse, UT 84075 and is currently estimated at $688,674, approximately $171 per square foot. 1357 W 2375 S is a home located in Davis County with nearby schools including Bluff Ridge Elementary, Legacy Junior High School, and Clearfield High School.
Ownership History
Date
Name
Owned For
Owner Type
Purchase Details
Closed on
Feb 1, 2016
Sold by
Vedaa Ronald B
Bought by
Vedaa Ronald B and Vedaa Shiloh
Current Estimated Value
Purchase Details
Closed on
Feb 10, 2012
Sold by
Pugh Thomas J and Pugh Janet M
Bought by
Vedaa Ronald B
Home Financials for this Owner
Home Financials are based on the most recent Mortgage that was taken out on this home.
Original Mortgage
$264,405
Interest Rate
3.9%
Mortgage Type
VA
Purchase Details
Closed on
May 13, 1998
Sold by
Rainey Construction Inc
Bought by
Pugh Thomas J and Pugh Janet M
Home Financials for this Owner
Home Financials are based on the most recent Mortgage that was taken out on this home.
Original Mortgage
$171,850
Interest Rate
7.13%
Create a Home Valuation Report for This Property
The Home Valuation Report is an in-depth analysis detailing your home's value as well as a comparison with similar homes in the area
Home Values in the Area
Average Home Value in this Area
Purchase History
| Date | Buyer | Sale Price | Title Company |
|---|---|---|---|
| Vedaa Ronald B | -- | Backman Title | |
| Vedaa Ronald B | -- | Us Title Company Of | |
| Pugh Thomas J | -- | First American Title Co |
Source: Public Records
Mortgage History
| Date | Status | Borrower | Loan Amount |
|---|---|---|---|
| Previous Owner | Vedaa Ronald B | $264,405 | |
| Previous Owner | Pugh Thomas J | $171,850 |
Source: Public Records
Tax History Compared to Growth
Tax History
| Year | Tax Paid | Tax Assessment Tax Assessment Total Assessment is a certain percentage of the fair market value that is determined by local assessors to be the total taxable value of land and additions on the property. | Land | Improvement |
|---|---|---|---|---|
| 2025 | $3,635 | $350,900 | $125,648 | $225,252 |
| 2024 | $3,426 | $332,749 | $104,570 | $228,179 |
| 2023 | $3,232 | $314,600 | $80,117 | $234,482 |
| 2022 | $3,395 | $599,000 | $152,297 | $446,703 |
| 2021 | $3,096 | $465,000 | $123,858 | $341,142 |
| 2020 | $2,771 | $403,000 | $107,567 | $295,433 |
| 2019 | $2,339 | $373,000 | $105,541 | $267,459 |
| 2018 | $0 | $348,000 | $101,715 | $246,285 |
| 2016 | $2,306 | $172,315 | $39,026 | $133,289 |
| 2015 | $2,206 | $156,970 | $39,026 | $117,944 |
| 2014 | $2,207 | $160,060 | $39,026 | $121,034 |
| 2013 | $2,281 | $156,737 | $39,105 | $117,632 |
Source: Public Records
Map
Nearby Homes