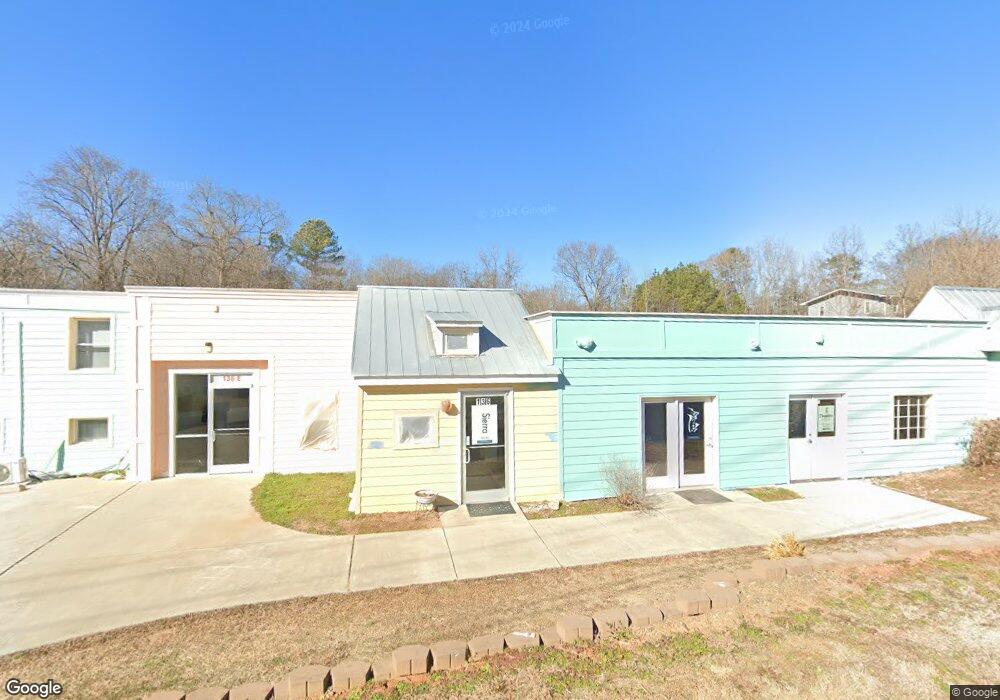
136 Fayetteville St Pittsboro, NC 27312
Estimated Value: $579,000
5
Beds
--
Bath
15,987
Sq Ft
$36/Sq Ft
Est. Value
About This Home
This home is located at 136 Fayetteville St, Pittsboro, NC 27312 and is currently priced at $579,000, approximately $36 per square foot. 136 Fayetteville St is a home located in Chatham County with nearby schools including Pittsboro Elementary School, George Moses Horton Middle School, and Northwood High.
Ownership History
Date
Name
Owned For
Owner Type
Purchase Details
Closed on
Jun 3, 2025
Sold by
Sevim Veli and Borkan-Sevim Umit
Bought by
Sevim Properties Llc
Current Estimated Value
Home Financials for this Owner
Home Financials are based on the most recent Mortgage that was taken out on this home.
Original Mortgage
$1,150,636
Outstanding Balance
$1,147,682
Interest Rate
6.81%
Mortgage Type
New Conventional
Purchase Details
Closed on
Jul 18, 2022
Sold by
Pittsboro Rentals Llc
Bought by
Sevim Veli and Sipal Cuneyt A
Purchase Details
Closed on
Jun 1, 2017
Sold by
Bianco Robert A and Bianco Donna L
Bought by
Pittsboro Rentals Llc
Purchase Details
Closed on
Jul 1, 2014
Sold by
Starr Lindsay E
Bought by
Bianco Robert A
Purchase Details
Closed on
Jul 5, 2007
Sold by
Starr Jonathan and Starr Lindsay
Bought by
Jonathan & Lindsay Starr Living Trust
Create a Home Valuation Report for This Property
The Home Valuation Report is an in-depth analysis detailing your home's value as well as a comparison with similar homes in the area
Home Values in the Area
Average Home Value in this Area
Purchase History
| Date | Buyer | Sale Price | Title Company |
|---|---|---|---|
| Sevim Properties Llc | -- | None Listed On Document | |
| Sevim Veli | -- | Messick Paul S | |
| Pittsboro Rentals Llc | $271,000 | None Available | |
| Bianco Robert A | $237,500 | None Available | |
| Jonathan & Lindsay Starr Living Trust | -- | None Available |
Source: Public Records
Mortgage History
| Date | Status | Borrower | Loan Amount |
|---|---|---|---|
| Open | Sevim Properties Llc | $1,150,636 |
Source: Public Records
Tax History Compared to Growth
Tax History
| Year | Tax Paid | Tax Assessment Tax Assessment Total Assessment is a certain percentage of the fair market value that is determined by local assessors to be the total taxable value of land and additions on the property. | Land | Improvement |
|---|---|---|---|---|
| 2025 | $12,177 | $1,170,847 | $195,287 | $975,560 |
| 2024 | $12,177 | $696,216 | $177,534 | $518,682 |
| 2023 | $8,111 | $696,216 | $177,534 | $518,682 |
| 2022 | $7,693 | $696,216 | $177,534 | $518,682 |
| 2021 | $7,647 | $696,216 | $177,534 | $518,682 |
| 2020 | $3,118 | $282,622 | $126,810 | $155,812 |
| 2019 | $2,941 | $266,553 | $126,810 | $139,743 |
| 2018 | $2,247 | $266,553 | $126,810 | $139,743 |
| 2017 | $2,247 | $211,727 | $126,810 | $84,917 |
| 2016 | $2,437 | $228,341 | $126,810 | $101,531 |
| 2015 | $2,409 | $228,341 | $126,810 | $101,531 |
| 2014 | $2,409 | $228,341 | $126,810 | $101,531 |
| 2013 | -- | $228,341 | $126,810 | $101,531 |
Source: Public Records
Map
Nearby Homes
- 162 Gaines Trail
- 0 N Carolina 902
- 00 N Carolina 902
- 0 Route 15
- 66 Toomer Loop Rd
- 316 Hillsboro St
- 298 E Salisbury St
- 425 Credle St
- 341 Windsong Dr
- 329 Windsong Dr
- Tbd Versailles Ln
- 122 Bridle Path
- 248 Ashford Dr
- 230 Oakwood Dr
- 116 Kensington Dr
- 49 Lesley Ct
- 90 Chatham Mill Rd
- 24 Cynthia Ln
- 0 Nc 87 Hwy Unit 2491586
- 344 May Farm Rd
- 136 Fayetteville St Unit E
- 118 Fayetteville St
- 320 Fayetteville St
- 83 Lockville St
- 100 Fayetteville St
- 65 Lockville St N
- 290 Chatham Dr
- 65 Lockville St
- 220 Pittsboro Elementary School Rd
- 92 W Chatham St
- 206 Pittsboro Elementary School Rd
- 47 Lockville St N
- 76 Fayetteville St
- 122 Sanford Rd
- 47 Lockville St
- 129 Sanford Rd
- 30 Lockville St
- 31 Lockville St N
- 31 Lockville St
- 231 Pittsboro Elementary School Rd