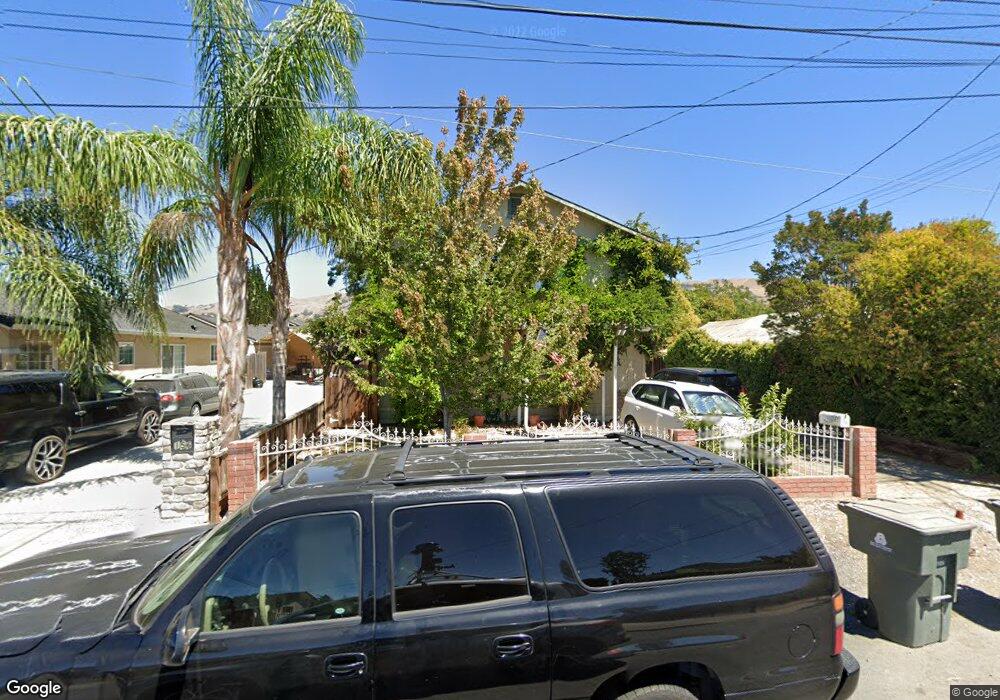
136 Talmadge Ave San Jose, CA 95127
Alum Rock NeighborhoodEstimated Value: $1,124,000 - $1,275,000
3
Beds
2
Baths
1,729
Sq Ft
$685/Sq Ft
Est. Value
About This Home
This home is located at 136 Talmadge Ave, San Jose, CA 95127 and is currently estimated at $1,185,216, approximately $685 per square foot. 136 Talmadge Ave is a home located in Santa Clara County with nearby schools including Linda Vista Elementary School, Joseph George Middle School, and James Lick High School.
Ownership History
Date
Name
Owned For
Owner Type
Purchase Details
Closed on
Jan 25, 2018
Sold by
Ghalib Yeaser Mohomade and Parra Ghalib Shanelle Jessica
Bought by
Ghalib Yeaser Mohomade and Parra Ghalib Shanelle Jessica
Current Estimated Value
Home Financials for this Owner
Home Financials are based on the most recent Mortgage that was taken out on this home.
Original Mortgage
$573,026
Outstanding Balance
$484,690
Interest Rate
3.94%
Mortgage Type
VA
Estimated Equity
$700,526
Purchase Details
Closed on
Jun 21, 2010
Sold by
Loredo Dora Lara
Bought by
Ghalib Yeaser M and Lopez Parra Shanelle J
Home Financials for this Owner
Home Financials are based on the most recent Mortgage that was taken out on this home.
Original Mortgage
$399,618
Interest Rate
4.91%
Mortgage Type
FHA
Create a Home Valuation Report for This Property
The Home Valuation Report is an in-depth analysis detailing your home's value as well as a comparison with similar homes in the area
Home Values in the Area
Average Home Value in this Area
Purchase History
| Date | Buyer | Sale Price | Title Company |
|---|---|---|---|
| Ghalib Yeaser Mohomade | -- | Fidelity National Title Co | |
| Ghalib Yeaser M | $405,000 | Old Republic Title Company |
Source: Public Records
Mortgage History
| Date | Status | Borrower | Loan Amount |
|---|---|---|---|
| Open | Ghalib Yeaser Mohomade | $573,026 | |
| Closed | Ghalib Yeaser M | $399,618 |
Source: Public Records
Tax History Compared to Growth
Tax History
| Year | Tax Paid | Tax Assessment Tax Assessment Total Assessment is a certain percentage of the fair market value that is determined by local assessors to be the total taxable value of land and additions on the property. | Land | Improvement |
|---|---|---|---|---|
| 2025 | $5,610 | $522,765 | $418,218 | $104,547 |
| 2024 | $5,610 | $512,516 | $410,018 | $102,498 |
| 2023 | $5,541 | $502,468 | $401,979 | $100,489 |
| 2022 | $5,483 | $492,617 | $394,098 | $98,519 |
| 2021 | $7,050 | $482,959 | $386,371 | $96,588 |
| 2020 | $6,937 | $478,008 | $382,410 | $95,598 |
| 2019 | $6,766 | $468,636 | $374,912 | $93,724 |
| 2018 | $6,727 | $459,448 | $367,561 | $91,887 |
| 2017 | $6,765 | $450,440 | $360,354 | $90,086 |
| 2016 | $6,395 | $441,609 | $353,289 | $88,320 |
| 2015 | $6,404 | $434,977 | $347,983 | $86,994 |
| 2014 | $6,239 | $426,457 | $341,167 | $85,290 |
Source: Public Records
Map
Nearby Homes
- 160 Talmadge Ave
- 80 Pickford Ave
- 124 Cedar Ln
- 3101 Starburst Ct
- 207 N Claremont Ave
- 75 S Cragmont Ave
- 58 Clareview Ave
- 292 N Cragmont Ave
- 3014 Florence Ave
- 2925 Florence Ave Unit 17
- 2925 Florence Ave Unit 67
- 2925 Florence Ave Unit 82
- 3405 E Hills Dr
- 0 Gordon Blvd Unit 231524
- 0 Gordon Blvd Unit FR25034343
- 0 Gordon Blvd Unit 625465
- 0 Gordon Blvd Unit SR23111317
- 3278 Faith Ct
- 236 S Claremont Ave
- 259 N Capitol Ave Unit 131
- 128 Talmadge Ave
- 156 Talmadge Ave
- 124 Talmadge Ave
- 120 Talmadge Ave
- 168 Talmadge Ave
- 165 Pickford Ave
- 176 Talmadge Ave
- 135 Pickford Ave
- 151 Pickford Ave
- 167 Pickford Ave
- 151 Talmadge Ave
- 119 Pickford Ave
- 4425 Hyland Ave
- 4411 Hyland Ave
- 4455 Hyland Ave
- 175 Talmadge Ave
- 157 Talmadge Ave
- 119 Talmadge Ave
- 117 Pickford Ave
- 180 Talmadge Ave