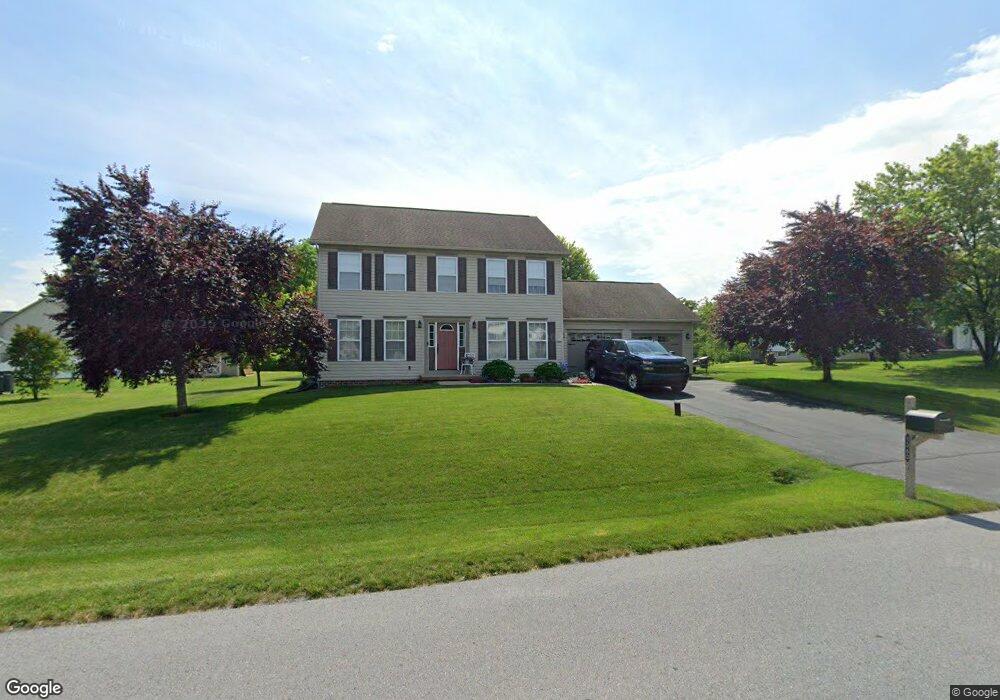
1360 Mallard Dr E Chambersburg, PA 17202
Estimated Value: $369,000 - $380,000
--
Bed
1
Bath
2,040
Sq Ft
$184/Sq Ft
Est. Value
About This Home
This home is located at 1360 Mallard Dr E, Chambersburg, PA 17202 and is currently estimated at $374,667, approximately $183 per square foot. 1360 Mallard Dr E is a home located in Franklin County with nearby schools including Chambersburg Area Middle School - North, Chambersburg Area Senior High School, and Shalom Christian Academy.
Ownership History
Date
Name
Owned For
Owner Type
Purchase Details
Closed on
Dec 14, 2012
Sold by
Mansberger Kevin E and Mansberger Kelly J
Bought by
Mansberger Kelly J
Current Estimated Value
Home Financials for this Owner
Home Financials are based on the most recent Mortgage that was taken out on this home.
Original Mortgage
$217,150
Outstanding Balance
$150,379
Interest Rate
3.36%
Mortgage Type
New Conventional
Estimated Equity
$224,288
Purchase Details
Closed on
Jun 27, 2006
Sold by
Warm Spring Ridge Lp
Bought by
Mansberger Kevin E and Mansberger Kelly J
Home Financials for this Owner
Home Financials are based on the most recent Mortgage that was taken out on this home.
Original Mortgage
$191,140
Interest Rate
7.62%
Mortgage Type
Construction
Create a Home Valuation Report for This Property
The Home Valuation Report is an in-depth analysis detailing your home's value as well as a comparison with similar homes in the area
Home Values in the Area
Average Home Value in this Area
Purchase History
| Date | Buyer | Sale Price | Title Company |
|---|---|---|---|
| Mansberger Kelly J | -- | None Available | |
| Mansberger Kevin E | $64,900 | None Available |
Source: Public Records
Mortgage History
| Date | Status | Borrower | Loan Amount |
|---|---|---|---|
| Open | Mansberger Kelly J | $217,150 | |
| Closed | Mansberger Kevin E | $191,140 | |
| Closed | Mansberger Kevin E | $23,850 |
Source: Public Records
Tax History Compared to Growth
Tax History
| Year | Tax Paid | Tax Assessment Tax Assessment Total Assessment is a certain percentage of the fair market value that is determined by local assessors to be the total taxable value of land and additions on the property. | Land | Improvement |
|---|---|---|---|---|
| 2025 | $4,272 | $26,160 | $1,260 | $24,900 |
| 2024 | $4,139 | $26,160 | $1,260 | $24,900 |
| 2023 | $4,010 | $26,160 | $1,260 | $24,900 |
| 2022 | $3,894 | $26,010 | $1,260 | $24,750 |
| 2021 | $3,894 | $26,010 | $1,260 | $24,750 |
| 2020 | $3,793 | $26,010 | $1,260 | $24,750 |
| 2019 | $3,647 | $26,010 | $1,260 | $24,750 |
| 2018 | $3,511 | $26,010 | $1,260 | $24,750 |
| 2017 | $3,392 | $26,010 | $1,260 | $24,750 |
| 2016 | $745 | $26,010 | $1,260 | $24,750 |
| 2015 | $694 | $26,010 | $1,260 | $24,750 |
| 2014 | $694 | $26,010 | $1,260 | $24,750 |
Source: Public Records
Map
Nearby Homes
- 1312 Mallard Dr E Unit 156
- 2052 Mandarin Dr
- 1555 Finch Dr
- TBD Mandarin Dr
- 1449 Mallard Dr E Unit 72
- 1701 Falcon Ln
- 1496 Falcon Ln Unit 253
- 1508 Falcon Ln Unit 252
- 1520 Falcon Ln Unit 251
- TBD Falcon Ln
- 1656 Falcon Ln Unit 242
- 1441 Falcon Ln
- 1645 Falcon Ln Unit 195
- 1024 Warm Spring Rd
- 1180 Leisure Dr Unit 57
- Carnegie II Plan at Spring View Farms
- Skylark II Plan at Spring View Farms
- Edgewood II Plan at Spring View Farms
- Glenshaw II Plan at Spring View Farms
- Whitehall II Plan at Spring View Farms
- 1368 Mallard Dr E
- 1368 Mallard Dr E Unit 130
- 1352 Mallard Dr E
- 1353 Mallard Dr E
- 1376 Mallard Dr E
- 1670 Raven Dr
- 1345 Mallard Dr E
- 1345 Mallard Dr E Unit LOT 158
- 1361 Mallard Dr E
- 1795 Wood Duck Dr E
- 1384 Mallard Dr E
- 1671 Raven Dr
- 1710 Raven Dr
- 1730 Raven Dr
- 1801 Falcon Ln Unit 134
- 1801 Falcon Ln
- 1369 Mallard Dr E
- 1744 Raven Dr
- 1335 Mallard Dr E
- 1807 Falcon Ln