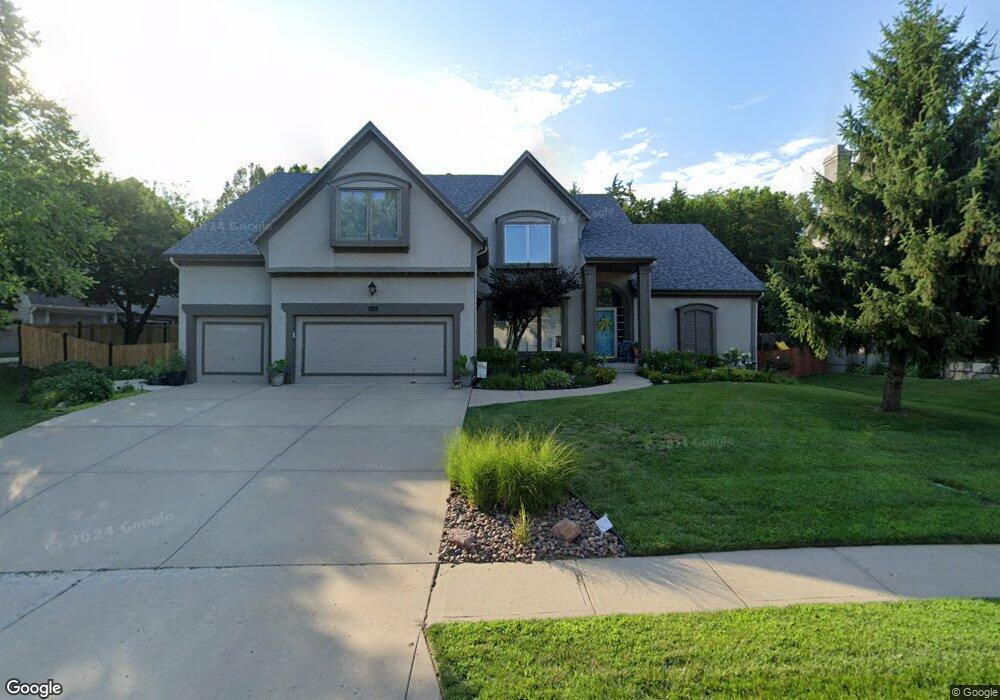
13604 W 53rd Terrace Shawnee, KS 66216
Estimated Value: $547,928 - $564,000
4
Beds
4
Baths
3,153
Sq Ft
$176/Sq Ft
Est. Value
About This Home
This home is located at 13604 W 53rd Terrace, Shawnee, KS 66216 and is currently estimated at $556,232, approximately $176 per square foot. 13604 W 53rd Terrace is a home located in Johnson County with nearby schools including Ray Marsh Elementary School, Trailridge Middle School, and Shawnee Mission Northwest High School.
Ownership History
Date
Name
Owned For
Owner Type
Purchase Details
Closed on
Mar 3, 2010
Sold by
Scott Cheryl A
Bought by
Cooper David F and Cooper Joy K
Current Estimated Value
Home Financials for this Owner
Home Financials are based on the most recent Mortgage that was taken out on this home.
Original Mortgage
$232,800
Outstanding Balance
$154,218
Interest Rate
4.97%
Mortgage Type
New Conventional
Estimated Equity
$402,014
Purchase Details
Closed on
Jul 16, 2009
Sold by
Scott Cheryl A
Bought by
Scott Cheryl A
Purchase Details
Closed on
Mar 5, 2001
Sold by
Great Plains Investment Co Llc
Bought by
Scott Robert F and Scott Cheryl A
Home Financials for this Owner
Home Financials are based on the most recent Mortgage that was taken out on this home.
Original Mortgage
$263,920
Interest Rate
7.19%
Create a Home Valuation Report for This Property
The Home Valuation Report is an in-depth analysis detailing your home's value as well as a comparison with similar homes in the area
Home Values in the Area
Average Home Value in this Area
Purchase History
| Date | Buyer | Sale Price | Title Company |
|---|---|---|---|
| Cooper David F | $291,000 | Cbkc Title & Escrow Llc | |
| Scott Cheryl A | -- | None Available | |
| Scott Robert F | -- | Security Land Title Company |
Source: Public Records
Mortgage History
| Date | Status | Borrower | Loan Amount |
|---|---|---|---|
| Open | Cooper David F | $232,800 | |
| Previous Owner | Scott Robert F | $263,920 |
Source: Public Records
Tax History Compared to Growth
Tax History
| Year | Tax Paid | Tax Assessment Tax Assessment Total Assessment is a certain percentage of the fair market value that is determined by local assessors to be the total taxable value of land and additions on the property. | Land | Improvement |
|---|---|---|---|---|
| 2024 | $5,290 | $49,761 | $10,948 | $38,813 |
| 2023 | $5,236 | $48,771 | $10,429 | $38,342 |
| 2022 | $4,970 | $46,138 | $10,429 | $35,709 |
| 2021 | $4,837 | $42,262 | $9,485 | $32,777 |
| 2020 | $4,605 | $39,698 | $8,300 | $31,398 |
| 2019 | $4,577 | $39,434 | $7,551 | $31,883 |
| 2018 | $4,533 | $38,916 | $7,551 | $31,365 |
| 2017 | $4,678 | $39,548 | $6,879 | $32,669 |
| 2016 | $4,673 | $39,008 | $6,879 | $32,129 |
| 2015 | $4,410 | $38,053 | $6,879 | $31,174 |
| 2013 | -- | $32,315 | $6,879 | $25,436 |
Source: Public Records
Map
Nearby Homes
- 5300 Summit Ct
- 13810 W 53rd St
- 5507 Noland Rd
- 5530 Rene St
- 5021 Bradshaw St
- 5013 Bradshaw St
- 14210 W 50th St
- 5502 Mullen Rd
- 14105 W 48th Terrace
- 13305 W 51st St
- 5703 Cottonwood St
- 5713 Widmer Rd
- 14170 W 49th St
- 5633 Oakview St
- 4940 Alden St
- 5807 Noland Rd
- 12809 W 57th Terrace
- 13130 W 52nd Terrace
- 13126 W 52nd Terrace
- 13134 W 52nd Terrace
- 13600 W 53rd Terrace
- 13608 W 53rd Terrace
- 5301 Park St
- 13518 W 53rd Terrace
- 5213 Park St
- 13601 W 53rd Terrace
- 13605 W 53rd Terrace
- 13519 W 53rd Terrace
- 5209 Park St
- 13609 W 53rd Terrace
- 13515 W 53rd Terrace
- 5306 Park St
- 13514 W 53rd Terrace
- 5205 Park St
- 5310 Park St
- 13711 W 53rd St
- 5313 Park St
- 13509 W 53rd Terrace
- 5216 Park St
- 13510 W 53rd Terrace