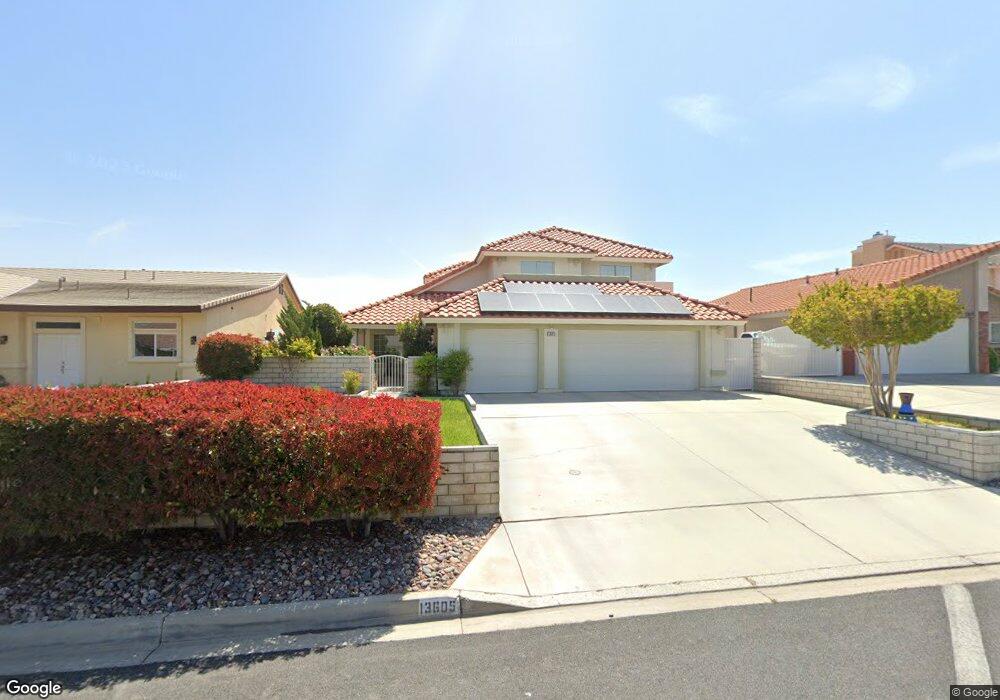
13605 Hidden Valley Rd Victorville, CA 92395
Estimated Value: $524,001 - $636,000
4
Beds
3
Baths
2,492
Sq Ft
$228/Sq Ft
Est. Value
About This Home
This home is located at 13605 Hidden Valley Rd, Victorville, CA 92395 and is currently estimated at $568,250, approximately $228 per square foot. 13605 Hidden Valley Rd is a home located in San Bernardino County with nearby schools including Lomitas Elementary School, Mojave Vista Elementary School, and Lakeview Leadership Academy.
Ownership History
Date
Name
Owned For
Owner Type
Purchase Details
Closed on
Mar 9, 2018
Sold by
Sun Jingming and Liu Dan
Bought by
Dixon Regina T and Morgan Glynnis T
Current Estimated Value
Home Financials for this Owner
Home Financials are based on the most recent Mortgage that was taken out on this home.
Original Mortgage
$293,550
Outstanding Balance
$251,549
Interest Rate
4.38%
Mortgage Type
New Conventional
Estimated Equity
$316,701
Purchase Details
Closed on
Jul 1, 2013
Sold by
Scheer Gary L and Scheer Beverly A
Bought by
Sun Jingming and Liu Dan
Home Financials for this Owner
Home Financials are based on the most recent Mortgage that was taken out on this home.
Original Mortgage
$150,600
Interest Rate
5.25%
Mortgage Type
Adjustable Rate Mortgage/ARM
Purchase Details
Closed on
Jun 6, 2007
Sold by
Scheer Gary Lee and Scheer Beverly Ann
Bought by
Scheer Gary L and Scheer Beverly A
Create a Home Valuation Report for This Property
The Home Valuation Report is an in-depth analysis detailing your home's value as well as a comparison with similar homes in the area
Home Values in the Area
Average Home Value in this Area
Purchase History
| Date | Buyer | Sale Price | Title Company |
|---|---|---|---|
| Dixon Regina T | $309,000 | Chicago Title Inland Empire | |
| Sun Jingming | $251,000 | Chicago Title | |
| Scheer Gary L | -- | None Available |
Source: Public Records
Mortgage History
| Date | Status | Borrower | Loan Amount |
|---|---|---|---|
| Open | Dixon Regina T | $293,550 | |
| Previous Owner | Sun Jingming | $150,600 |
Source: Public Records
Tax History Compared to Growth
Tax History
| Year | Tax Paid | Tax Assessment Tax Assessment Total Assessment is a certain percentage of the fair market value that is determined by local assessors to be the total taxable value of land and additions on the property. | Land | Improvement |
|---|---|---|---|---|
| 2025 | $5,508 | $351,589 | $70,318 | $281,271 |
| 2024 | $5,508 | $344,695 | $68,939 | $275,756 |
| 2023 | $5,467 | $337,936 | $67,587 | $270,349 |
| 2022 | $5,882 | $331,310 | $66,262 | $265,048 |
| 2021 | $5,807 | $324,814 | $64,963 | $259,851 |
| 2020 | $5,803 | $321,484 | $64,297 | $257,187 |
| 2019 | $4,053 | $315,180 | $63,036 | $252,144 |
| 2018 | $3,640 | $270,420 | $54,084 | $216,336 |
| 2017 | $3,481 | $265,118 | $53,024 | $212,094 |
| 2016 | $3,411 | $259,919 | $51,984 | $207,935 |
| 2015 | $3,289 | $256,015 | $51,203 | $204,812 |
| 2014 | $3,240 | $251,000 | $50,200 | $200,800 |
Source: Public Records
Map
Nearby Homes
- 13610 Sierra Vista Dr
- 13665 Hidden Valley Rd
- 13685 Hidden Valley Rd
- 13570 Chinquapin Dr
- 13685 Sierra Vista Dr
- 17800 Rancho Bonita Rd
- 17830 San Gabriel Ln
- 17755 Rancho Bonita Rd
- 17850 Portside Ln
- 13660 Spring Valley Pkwy
- 13415 Hidden Valley Rd
- 13699 Spring Valley Pkwy
- 13425 Chinquapin Dr
- 17760 Honeycomb Ln
- 13710 White Sail Dr
- 13700 White Sail Dr
- 13486 Jubilee Place
- 17965 Fremontia Ln
- 13835 Spring Valley Pkwy
- 13480 Spring Valley Pkwy Unit /15
- 13605 Hidden Creek Dr
- 13615 Hidden Valley Rd
- 13585 Hidden Valley Rd
- 13625 Hidden Valley Rd
- 13600 Sierra Vista Dr
- 13590 Sierra Vista Dr
- 13575 Hidden Valley Rd
- 13580 Sierra Vista Dr
- 13635 Hidden Valley Rd
- 13620 Sierra Vista Dr
- 13590 Hidden Valley Rd
- 13620 Hidden Valley Rd
- 13610 Hidden Valley Rd
- 13630 Sierra Vista Dr
- 13570 Sierra Vista Dr
- 13565 Hidden Creek Dr
- 13565 Hidden Valley Rd
- 13645 Hidden Valley Rd
- 13560 Hidden Valley Rd
- 13570 Hidden Valley Rd