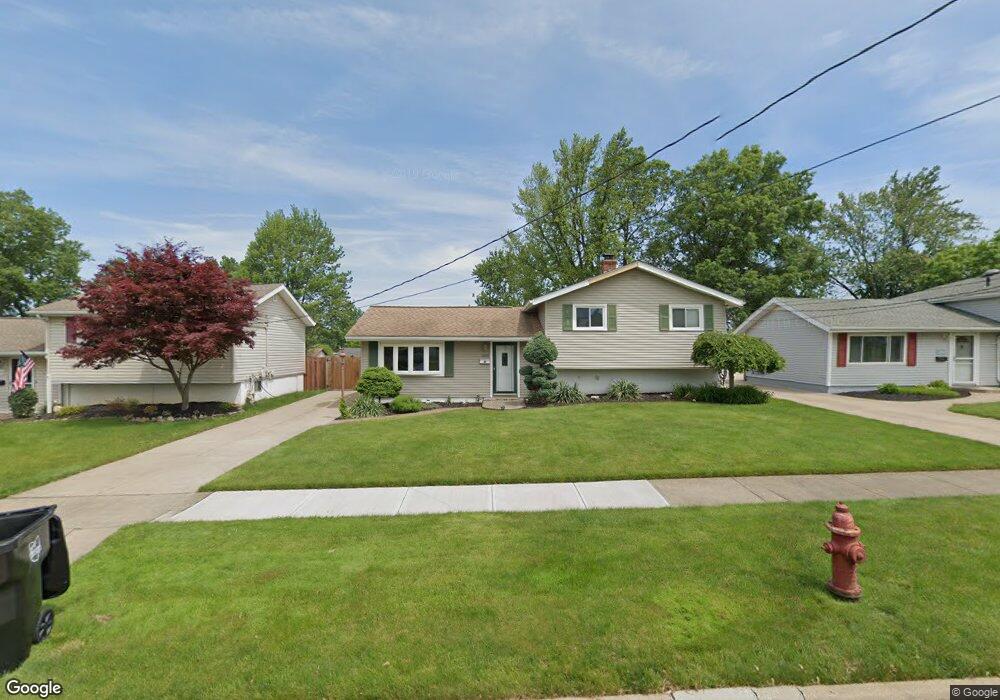
13616 Havendale Dr Brookpark, OH 44142
Estimated Value: $232,798 - $247,000
3
Beds
2
Baths
1,518
Sq Ft
$158/Sq Ft
Est. Value
About This Home
This home is located at 13616 Havendale Dr, Brookpark, OH 44142 and is currently estimated at $239,700, approximately $157 per square foot. 13616 Havendale Dr is a home located in Cuyahoga County with nearby schools including Berea-Midpark Middle School, Berea-Midpark High School, and Huber Heights Preparatory Academy Parma Academy.
Ownership History
Date
Name
Owned For
Owner Type
Purchase Details
Closed on
Jul 28, 2013
Sold by
Sanfillippo Mark A and Sanfillippo Beverly L
Bought by
Sanfillippo Beverly L
Current Estimated Value
Purchase Details
Closed on
Jul 3, 1995
Sold by
Tallari Scott A
Bought by
Sanfilippo Mark A and Sheppard Beverly L
Home Financials for this Owner
Home Financials are based on the most recent Mortgage that was taken out on this home.
Original Mortgage
$96,700
Interest Rate
7.88%
Mortgage Type
New Conventional
Purchase Details
Closed on
Apr 28, 1993
Sold by
Tollari Scott A
Bought by
Tollari Rebecca A
Purchase Details
Closed on
Sep 12, 1991
Sold by
Tollari Becky Ow
Bought by
Tollari Scott A
Purchase Details
Closed on
Aug 1, 1985
Sold by
Oconnor Richard J and Oconnor Diane E
Bought by
Connor Richard J O
Purchase Details
Closed on
Jan 1, 1975
Bought by
Oconnor Richard J and Oconnor Diane E
Create a Home Valuation Report for This Property
The Home Valuation Report is an in-depth analysis detailing your home's value as well as a comparison with similar homes in the area
Home Values in the Area
Average Home Value in this Area
Purchase History
| Date | Buyer | Sale Price | Title Company |
|---|---|---|---|
| Sanfillippo Beverly L | -- | Attorney | |
| Sanfilippo Mark A | $107,500 | -- | |
| Tollari Rebecca A | -- | -- | |
| Tollari Scott A | -- | -- | |
| Tollari Becky Ow | -- | -- | |
| Connor Richard J O | -- | -- | |
| Oconnor Richard J | -- | -- |
Source: Public Records
Mortgage History
| Date | Status | Borrower | Loan Amount |
|---|---|---|---|
| Previous Owner | Sanfilippo Mark A | $96,700 |
Source: Public Records
Tax History Compared to Growth
Tax History
| Year | Tax Paid | Tax Assessment Tax Assessment Total Assessment is a certain percentage of the fair market value that is determined by local assessors to be the total taxable value of land and additions on the property. | Land | Improvement |
|---|---|---|---|---|
| 2024 | $3,264 | $64,715 | $14,980 | $49,735 |
| 2023 | $3,164 | $51,950 | $11,380 | $40,570 |
| 2022 | $3,142 | $51,940 | $11,375 | $40,565 |
| 2021 | $3,124 | $51,940 | $11,380 | $40,570 |
| 2020 | $2,817 | $41,230 | $9,030 | $32,200 |
| 2019 | $2,732 | $117,800 | $25,800 | $92,000 |
| 2018 | $2,721 | $41,230 | $9,030 | $32,200 |
| 2017 | $2,624 | $36,720 | $7,600 | $29,120 |
| 2016 | $2,602 | $36,720 | $7,600 | $29,120 |
| 2015 | $2,326 | $36,720 | $7,600 | $29,120 |
| 2014 | $2,326 | $34,970 | $7,250 | $27,720 |
Source: Public Records
Map
Nearby Homes
- 13489 Havendale Dr
- 13602 Holland Rd
- 14055 Donald Dr
- 14344 Fayette Blvd
- 13971 Park Dr
- 6212 Elmdale Rd
- 6321 W 130th St
- 13931 Franklyn Blvd
- 6333 W 130th St
- 6274 Anita Dr
- 13879 Zaremba Dr
- 5677 Gateway Ln Unit E504
- 6330 Michael Dr
- 6369 Anita Dr
- 6359 Middlebrook Blvd
- 6413 Alexandria Dr
- 11914 Tucson Dr
- 15450 Holland Rd
- 6566 Elmdale Rd
- 14340 Kingman Dr
- 13642 Havendale Dr
- 13592 Havendale Dr
- 13666 Havendale Dr
- 13566 Havendale Dr
- 13615 Heatherwood Dr
- 13641 Heatherwood Dr
- 13591 Heatherwood Dr
- 13692 Havendale Dr
- 13542 Havendale Dr
- 13665 Heatherwood Dr
- 13565 Heatherwood Dr
- 13613 Havendale Dr
- 13639 Havendale Dr
- 13589 Havendale Dr
- 13541 Heatherwood Dr
- 13691 Heatherwood Dr
- 13716 Havendale Dr
- 13516 Havendale Dr
- 13663 Havendale Dr
- 13563 Havendale Dr