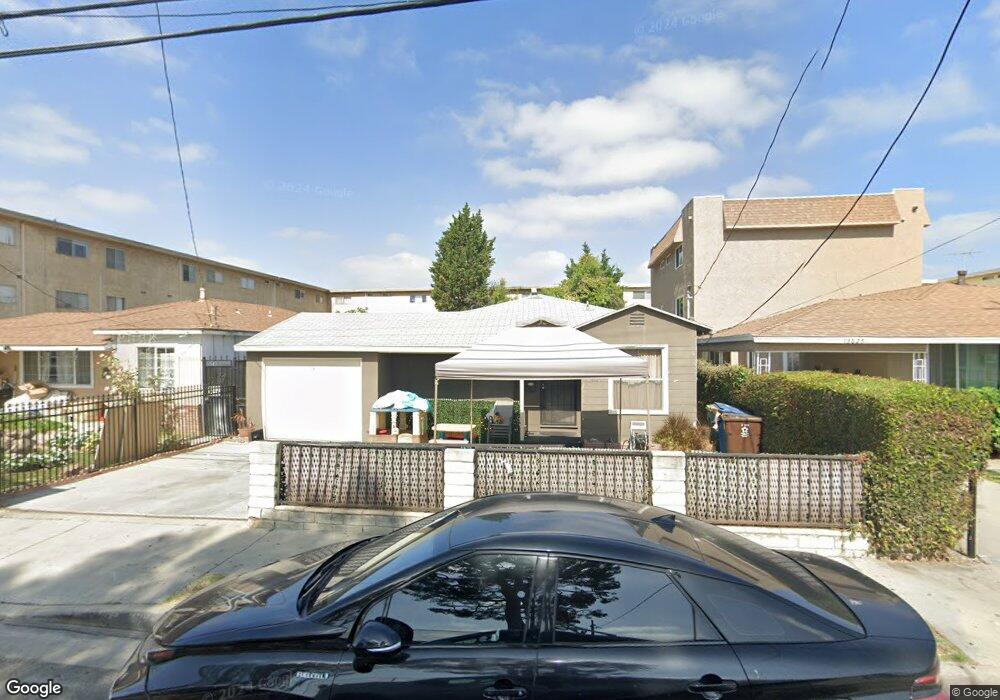
13627 Yukon Ave Hawthorne, CA 90250
Estimated Value: $647,000 - $783,000
3
Beds
1
Bath
946
Sq Ft
$760/Sq Ft
Est. Value
About This Home
This home is located at 13627 Yukon Ave, Hawthorne, CA 90250 and is currently estimated at $719,182, approximately $760 per square foot. 13627 Yukon Ave is a home located in Los Angeles County with nearby schools including Zela Davis Elementary School, Bud Carson Middle School, and Leuzinger High School.
Ownership History
Date
Name
Owned For
Owner Type
Purchase Details
Closed on
Sep 23, 2025
Sold by
Phillips Lonnie and Phillips Tanesha
Bought by
Phillips Trust and Phillips
Current Estimated Value
Purchase Details
Closed on
Jul 5, 2013
Sold by
Phillips Lonnie
Bought by
Phillips Tanesha
Purchase Details
Closed on
Mar 9, 2005
Sold by
Dudley Tanesha
Bought by
Phillips Lonnie
Purchase Details
Closed on
May 26, 1998
Sold by
Bank Of America Nt & Sa
Bought by
Dudley Tanesha
Home Financials for this Owner
Home Financials are based on the most recent Mortgage that was taken out on this home.
Original Mortgage
$124,131
Interest Rate
7.17%
Mortgage Type
FHA
Purchase Details
Closed on
Feb 20, 1998
Sold by
Cuevas Juliette M and Bank Of America National Tr &
Bought by
Bank Of America National Tr & Svgs Assn
Create a Home Valuation Report for This Property
The Home Valuation Report is an in-depth analysis detailing your home's value as well as a comparison with similar homes in the area
Home Values in the Area
Average Home Value in this Area
Purchase History
| Date | Buyer | Sale Price | Title Company |
|---|---|---|---|
| Phillips Trust | -- | None Listed On Document | |
| Phillips Lonnie | -- | None Listed On Document | |
| Phillips Tanesha | -- | None Available | |
| Phillips Lonnie | -- | United Title Company | |
| Dudley Tanesha | $125,000 | Old Republic Title Company | |
| Bank Of America National Tr & Svgs Assn | $78,750 | Fidelity National Title Ins |
Source: Public Records
Mortgage History
| Date | Status | Borrower | Loan Amount |
|---|---|---|---|
| Previous Owner | Dudley Tanesha | $124,131 |
Source: Public Records
Tax History Compared to Growth
Tax History
| Year | Tax Paid | Tax Assessment Tax Assessment Total Assessment is a certain percentage of the fair market value that is determined by local assessors to be the total taxable value of land and additions on the property. | Land | Improvement |
|---|---|---|---|---|
| 2025 | $2,869 | $199,570 | $159,665 | $39,905 |
| 2024 | $2,869 | $195,658 | $156,535 | $39,123 |
| 2023 | $2,776 | $191,822 | $153,466 | $38,356 |
| 2022 | $2,810 | $188,061 | $150,457 | $37,604 |
| 2021 | $2,773 | $184,374 | $147,507 | $36,867 |
| 2019 | $2,684 | $178,907 | $143,133 | $35,774 |
| 2018 | $2,563 | $175,400 | $140,327 | $35,073 |
| 2016 | $2,449 | $168,591 | $134,879 | $33,712 |
| 2015 | $2,397 | $166,059 | $132,853 | $33,206 |
| 2014 | $2,392 | $162,807 | $130,251 | $32,556 |
Source: Public Records
Map
Nearby Homes
- 3512 W 135th St
- 3353 W 135th St
- 3357 W 134th Place
- 14002 Cerise Ave Unit 11
- 14012 Cerise Ave Unit 3
- 14110 Yukon Ave
- 3506 W 133rd St
- 13534 Cordary Ave Unit 14
- 13945 Lemoli Ave
- 14050 Lemoli Way
- 13717 Chadron Ave
- 3609 W 144th St
- 14026 Lemoli Ave Unit C
- 14405 Cerise Ave Unit 35
- 3237 W 132nd St
- 14540 Yukon Ave
- 14324 Chadron Ave
- 12914 Doty Ave
- 14709 Bodger Ave
- 12716 Kornblum Ave
- 13631 Yukon Ave
- 13625 Yukon Ave
- 13619 Yukon Ave
- 13707 Yukon Ave Unit 10
- 13707 Yukon Ave Unit 8
- 13707 Yukon Ave
- 13713 Yukon Ave
- 13535 Yukon Ave Unit 23
- 13535 Yukon Ave Unit 10
- 13535 Yukon Ave Unit 35
- 13535 Yukon Ave Unit 40
- 13535 Yukon Ave Unit 44
- 13535 Yukon Ave Unit 2
- 13535 Yukon Ave Unit 34
- 13535 Yukon Ave Unit 37
- 13535 Yukon Ave Unit 18
- 13535 Yukon Ave Unit 6
- 13535 Yukon Ave Unit 14
- 13535 Yukon Ave Unit 42
- 13535 Yukon Ave Unit 43