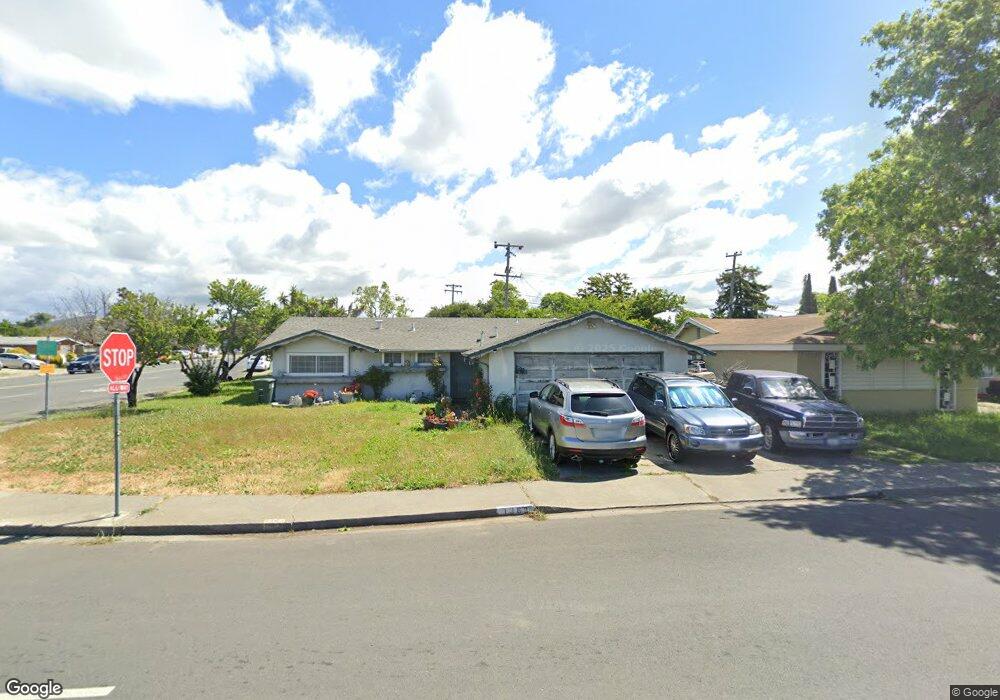
1363 Elliott Dr Vallejo, CA 94589
North Vallejo NeighborhoodEstimated Value: $415,810 - $466,000
3
Beds
2
Baths
1,046
Sq Ft
$427/Sq Ft
Est. Value
About This Home
This home is located at 1363 Elliott Dr, Vallejo, CA 94589 and is currently estimated at $446,703, approximately $427 per square foot. 1363 Elliott Dr is a home located in Solano County with nearby schools including Dan Mini Elementary School, Solano Middle School, and Vallejo High School.
Ownership History
Date
Name
Owned For
Owner Type
Purchase Details
Closed on
May 11, 2006
Sold by
Cowper Charles
Bought by
Cowper Charles C and Cowper Mary
Current Estimated Value
Home Financials for this Owner
Home Financials are based on the most recent Mortgage that was taken out on this home.
Original Mortgage
$108,000
Interest Rate
6.46%
Mortgage Type
Credit Line Revolving
Purchase Details
Closed on
Dec 20, 2004
Sold by
Cowper Charles C and Cowper Mary M
Bought by
Cowper Charles C and Cowper Mary
Purchase Details
Closed on
May 18, 2004
Sold by
The Cowper Family Trust and Cowper Charles C
Bought by
Cowper Charles C and Cowper Mary
Home Financials for this Owner
Home Financials are based on the most recent Mortgage that was taken out on this home.
Original Mortgage
$272,000
Interest Rate
5.77%
Mortgage Type
New Conventional
Purchase Details
Closed on
Apr 14, 2003
Sold by
Cowper Charles C and Cowper Mary M
Bought by
Cowper Charles C and Cowper Mary
Create a Home Valuation Report for This Property
The Home Valuation Report is an in-depth analysis detailing your home's value as well as a comparison with similar homes in the area
Home Values in the Area
Average Home Value in this Area
Purchase History
| Date | Buyer | Sale Price | Title Company |
|---|---|---|---|
| Cowper Charles C | -- | Financial Title Company | |
| Cowper Charles | -- | Financial Title Company | |
| Cowper Charles | -- | Financial Title Company | |
| Cowper Charles C | -- | -- | |
| Cowper Charles C | -- | -- | |
| Cowper Charles C | -- | -- |
Source: Public Records
Mortgage History
| Date | Status | Borrower | Loan Amount |
|---|---|---|---|
| Closed | Cowper Charles | $108,000 | |
| Closed | Cowper Charles C | $272,000 |
Source: Public Records
Tax History Compared to Growth
Tax History
| Year | Tax Paid | Tax Assessment Tax Assessment Total Assessment is a certain percentage of the fair market value that is determined by local assessors to be the total taxable value of land and additions on the property. | Land | Improvement |
|---|---|---|---|---|
| 2025 | $3,338 | $161,436 | $33,300 | $128,136 |
| 2024 | $3,338 | $158,272 | $32,648 | $125,624 |
| 2023 | $2,639 | $155,169 | $32,008 | $123,161 |
| 2022 | $2,768 | $152,128 | $31,381 | $120,747 |
| 2021 | $4,522 | $149,146 | $30,766 | $118,380 |
| 2020 | $2,465 | $147,618 | $30,451 | $117,167 |
| 2019 | $2,372 | $144,724 | $29,854 | $114,870 |
| 2018 | $2,835 | $141,887 | $29,269 | $112,618 |
| 2017 | $3,355 | $139,106 | $28,696 | $110,410 |
| 2016 | $2,314 | $136,380 | $28,134 | $108,246 |
| 2015 | $2,736 | $134,333 | $27,712 | $106,621 |
| 2014 | $2,299 | $131,703 | $27,170 | $104,533 |
Source: Public Records
Map
Nearby Homes
- 240 Rinaldo Dr
- 2041 Severus Dr
- 130 Kennison Ct
- 1863 Mini Dr
- 911 Falcon Dr
- 706 Capra Dr
- 316 Meadows Dr
- 121 Forsythia Ct
- 124 Purdue Dr
- 177 Brophy St
- 203 Baylor Dr Unit 11
- 102 Dartmouth Ave
- 148 Princeton Ave
- 150 Daisy Ct
- 2117 Elliott Dr
- 1634 Severus Dr
- 139 Marquette Ave
- 201 Redwing St
- 420 Corcoran Ave Unit 4
- 131 Fiddletown Ct