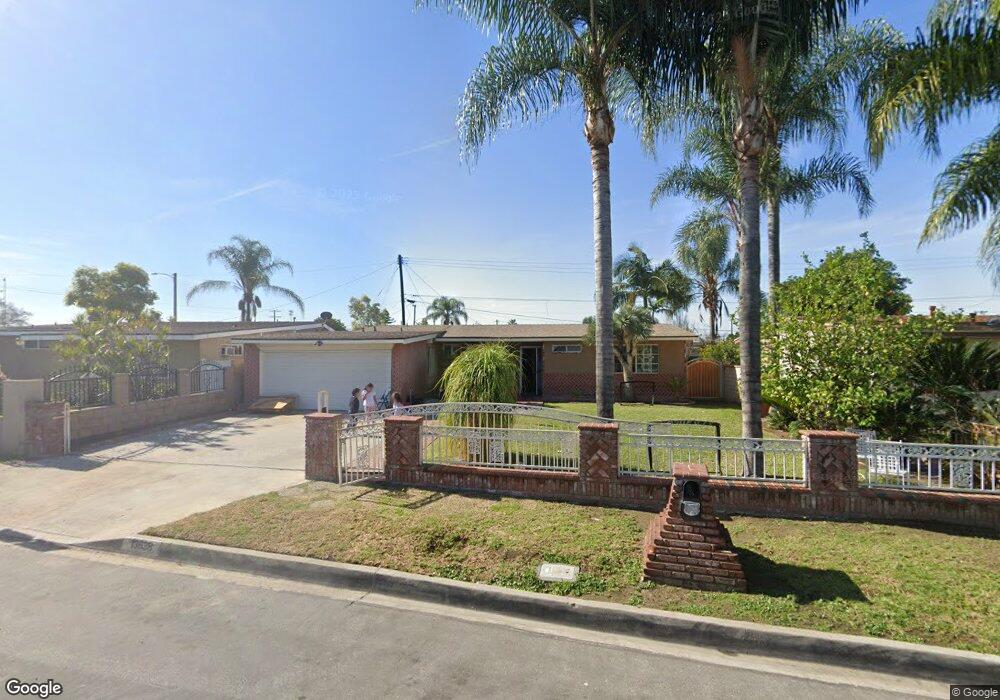
13638 Homeward St La Puente, CA 91746
West Puente Valley NeighborhoodEstimated Value: $687,397 - $755,000
4
Beds
2
Baths
1,115
Sq Ft
$655/Sq Ft
Est. Value
About This Home
This home is located at 13638 Homeward St, La Puente, CA 91746 and is currently estimated at $730,599, approximately $655 per square foot. 13638 Homeward St is a home located in Los Angeles County with nearby schools including J.E. Van Wig Elementary School, Torch Middle School, and Bassett Senior High School.
Ownership History
Date
Name
Owned For
Owner Type
Purchase Details
Closed on
Nov 20, 1997
Sold by
Kasicki Monica Lopez
Bought by
Tarango Connie
Current Estimated Value
Home Financials for this Owner
Home Financials are based on the most recent Mortgage that was taken out on this home.
Original Mortgage
$121,235
Outstanding Balance
$19,949
Interest Rate
7.31%
Mortgage Type
FHA
Estimated Equity
$710,650
Purchase Details
Closed on
Nov 17, 1997
Sold by
Tarango Connie
Bought by
Perez Anselmo
Home Financials for this Owner
Home Financials are based on the most recent Mortgage that was taken out on this home.
Original Mortgage
$121,235
Outstanding Balance
$19,949
Interest Rate
7.31%
Mortgage Type
FHA
Estimated Equity
$710,650
Purchase Details
Closed on
Jun 5, 1996
Sold by
Kasicki Robert
Bought by
Tarango Connie
Purchase Details
Closed on
Mar 10, 1995
Sold by
Tarango Connie
Bought by
Kasicki Robert and Kasicki Michael
Purchase Details
Closed on
Aug 3, 1994
Sold by
Tarango Connie
Bought by
Kasicki Robert and Kasicki Michael
Create a Home Valuation Report for This Property
The Home Valuation Report is an in-depth analysis detailing your home's value as well as a comparison with similar homes in the area
Home Values in the Area
Average Home Value in this Area
Purchase History
| Date | Buyer | Sale Price | Title Company |
|---|---|---|---|
| Tarango Connie | -- | Lawyers Title Company | |
| Perez Anselmo | $122,500 | Lawyers Title Company | |
| Tarango Connie | -- | -- | |
| Kasicki Robert | -- | -- | |
| Kasicki Robert | -- | -- |
Source: Public Records
Mortgage History
| Date | Status | Borrower | Loan Amount |
|---|---|---|---|
| Open | Perez Anselmo | $121,235 |
Source: Public Records
Tax History Compared to Growth
Tax History
| Year | Tax Paid | Tax Assessment Tax Assessment Total Assessment is a certain percentage of the fair market value that is determined by local assessors to be the total taxable value of land and additions on the property. | Land | Improvement |
|---|---|---|---|---|
| 2025 | $2,947 | $195,578 | $101,862 | $93,716 |
| 2024 | $2,947 | $191,744 | $99,865 | $91,879 |
| 2023 | $2,864 | $187,985 | $97,907 | $90,078 |
| 2022 | $2,749 | $184,300 | $95,988 | $88,312 |
| 2021 | $2,698 | $180,687 | $94,106 | $86,581 |
| 2019 | $2,636 | $175,330 | $91,316 | $84,014 |
| 2018 | $2,490 | $171,893 | $89,526 | $82,367 |
| 2016 | $2,390 | $165,219 | $86,050 | $79,169 |
| 2015 | $2,334 | $162,738 | $84,758 | $77,980 |
| 2014 | $2,235 | $159,551 | $83,098 | $76,453 |
Source: Public Records
Map
Nearby Homes
- 720 Le Borgne Ave
- 915 Stichman Ave
- 13622 Hartsville St
- 1003 Le Borgne Ave
- 979 Willow Ave Unit 31
- 943 Willow Ave
- 13426 Austen Way
- 610 Willow Ave
- 13903 Moccasin St
- 452 Willow Ave
- 335 Willow Ave
- 14104 Barrydale St
- 1416 Millbury Ave
- 544 N Orange Ave Unit B
- 14421 Flynn St
- 13974 Francisquito Ave Unit 8
- 1525 Bromley Ave
- 736 Tonopah Ave
- 13540 Valley Blvd
- 14510 Amar Rd Unit J
- 13632 Homeward St
- 13644 Homeward St
- 13639 Giordano St
- 13626 Homeward St
- 13633 Giordano St
- 13645 Giordano St
- 13627 Giordano St
- 13639 Homeward St
- 13645 Homeward St
- 13633 Homeward St
- 13620 Homeward St
- 13627 Homeward St
- 13621 Giordano St
- 13621 Homeward St
- 13614 Homeward St
- 13615 Giordano St
- 13642 Flynn St
- 13638 Giordano St
- 13644 Giordano St
- 13636 Flynn St