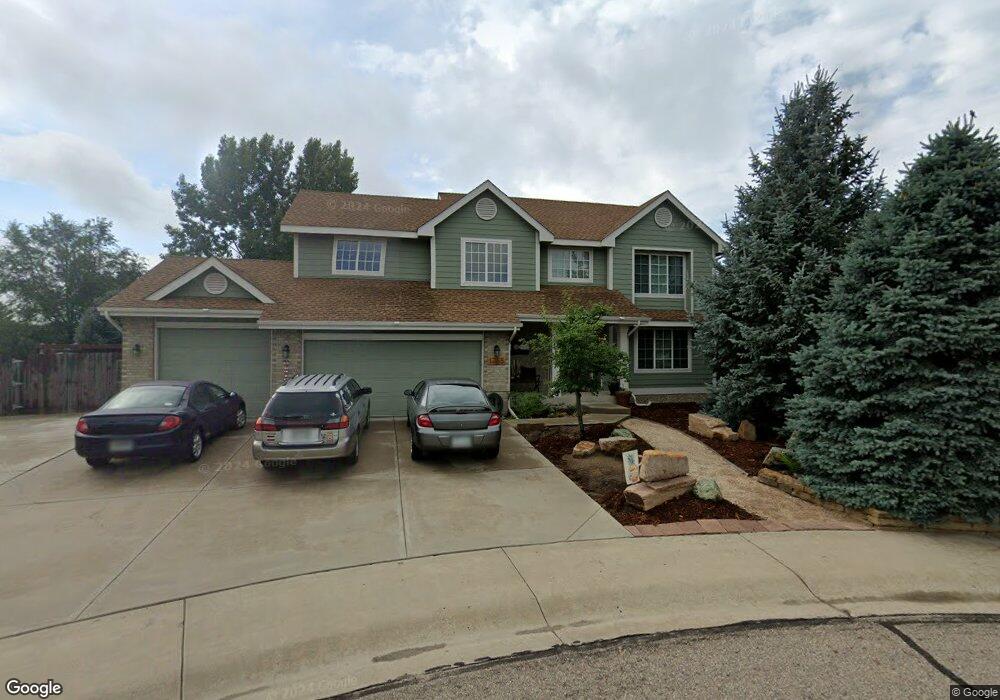
1365 Silverwood Ct Windsor, CO 80550
Estimated Value: $541,000 - $568,000
4
Beds
3
Baths
2,195
Sq Ft
$252/Sq Ft
Est. Value
About This Home
This home is located at 1365 Silverwood Ct, Windsor, CO 80550 and is currently estimated at $553,609, approximately $252 per square foot. 1365 Silverwood Ct is a home located in Weld County with nearby schools including Skyview Elementary School, Windsor Middle School, and Windsor High School.
Ownership History
Date
Name
Owned For
Owner Type
Purchase Details
Closed on
Mar 31, 2003
Sold by
Curry Russell A and Curry Lisa R Kastler
Bought by
Baak David J and Baak Mary Ann
Current Estimated Value
Home Financials for this Owner
Home Financials are based on the most recent Mortgage that was taken out on this home.
Original Mortgage
$169,000
Interest Rate
5.77%
Purchase Details
Closed on
Mar 6, 2002
Sold by
Baca Kevin R
Bought by
Curry Russell A and Curry Lisa R Kastler
Home Financials for this Owner
Home Financials are based on the most recent Mortgage that was taken out on this home.
Original Mortgage
$165,000
Interest Rate
6.93%
Purchase Details
Closed on
Mar 31, 1998
Sold by
Kem Homes Inc
Bought by
Baca Kevin R
Home Financials for this Owner
Home Financials are based on the most recent Mortgage that was taken out on this home.
Original Mortgage
$179,900
Interest Rate
7.04%
Purchase Details
Closed on
Mar 11, 1997
Sold by
Everitt Enterprises Inc
Bought by
Kem Homes Inc
Create a Home Valuation Report for This Property
The Home Valuation Report is an in-depth analysis detailing your home's value as well as a comparison with similar homes in the area
Home Values in the Area
Average Home Value in this Area
Purchase History
| Date | Buyer | Sale Price | Title Company |
|---|---|---|---|
| Baak David J | $280,000 | -- | |
| Curry Russell A | $280,000 | -- | |
| Baca Kevin R | $199,900 | -- | |
| Kem Homes Inc | $36,000 | -- |
Source: Public Records
Mortgage History
| Date | Status | Borrower | Loan Amount |
|---|---|---|---|
| Closed | Baak David J | $169,000 | |
| Previous Owner | Curry Russell A | $165,000 | |
| Previous Owner | Baca Kevin R | $179,900 |
Source: Public Records
Tax History Compared to Growth
Tax History
| Year | Tax Paid | Tax Assessment Tax Assessment Total Assessment is a certain percentage of the fair market value that is determined by local assessors to be the total taxable value of land and additions on the property. | Land | Improvement |
|---|---|---|---|---|
| 2025 | $2,988 | $33,270 | $6,440 | $26,830 |
| 2024 | $2,988 | $33,270 | $6,440 | $26,830 |
| 2023 | $2,743 | $35,210 | $5,140 | $30,070 |
| 2022 | $2,511 | $25,760 | $5,210 | $20,550 |
| 2021 | $2,341 | $26,500 | $5,360 | $21,140 |
| 2020 | $2,286 | $26,390 | $5,010 | $21,380 |
| 2019 | $2,266 | $26,390 | $5,010 | $21,380 |
| 2018 | $2,129 | $23,470 | $3,240 | $20,230 |
| 2017 | $2,254 | $23,470 | $3,240 | $20,230 |
| 2016 | $2,154 | $22,660 | $3,180 | $19,480 |
| 2015 | $2,004 | $22,660 | $3,180 | $19,480 |
| 2014 | $1,799 | $19,070 | $3,420 | $15,650 |
Source: Public Records
Map
Nearby Homes
- 1501 Driftwood Ct
- 1507 Stonewood Ct
- 515 Trailwood Cir
- 904 Pine Dr
- 813 Walnut St
- 1421 Canal Dr
- 1625 Main St
- 1229 Founders Cir
- 1107 Crescent Dr
- 610 Oak St
- 1116 Grand Ave
- 1228 Fairfield Ave
- 1208 Fairfield Ave
- 1108 Basin Ct
- Summit Plan at Trevenna
- 1050 Fairfield Ave
- 1621 Sorenson Dr
- 1604 Sorenson Dr
- 1460 Boyle St
- 1686 Grand Ave Unit 2
- 1381 Silverwood Ct
- 1374 Waterwood Dr
- 1350 Silverwood Ct
- 1362 Waterwood Dr
- 1386 Waterwood Dr
- 1350 Waterwood Dr
- 1399 Silverwood Ct
- 1338 Waterwood Dr
- 1366 Silverwood Ct
- 1398 Waterwood Dr
- 1382 Silverwood Ct
- 1369 Waterwood Dr
- 1398 Silverwood Ct
- 1385 Waterwood Dr
- 1361 Waterwood Dr
- 1314 Waterwood Dr
- 1391 Waterwood Dr
- 1383 Walnut St
- 1391 Walnut St
- 1341 Waterwood Dr