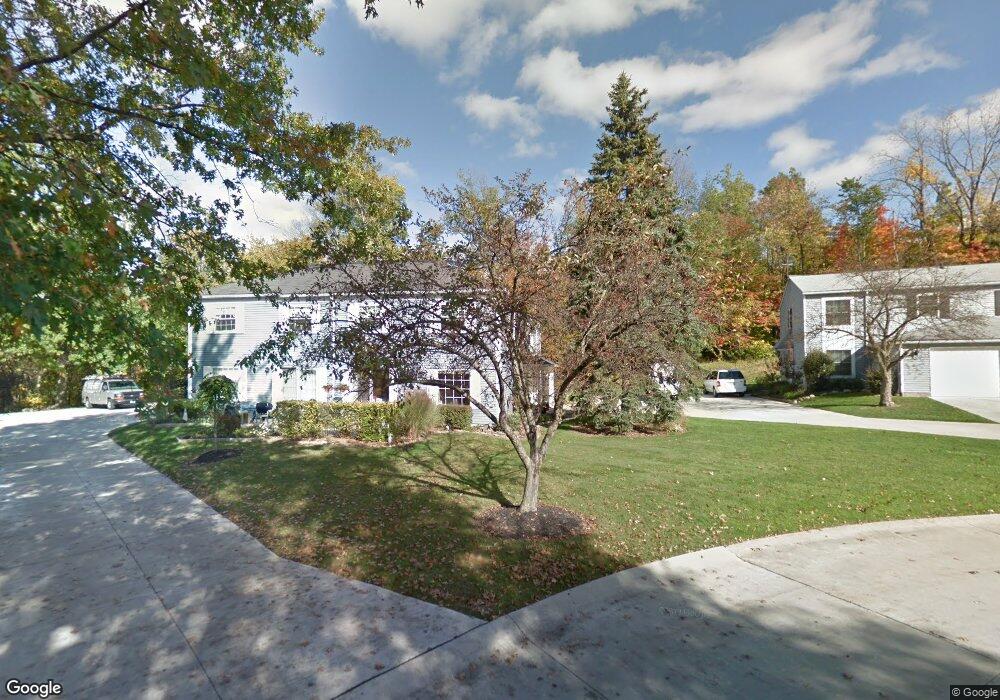
13652 Oakbrook Dr North Royalton, OH 44133
Estimated Value: $159,000 - $178,000
3
Beds
2
Baths
1,248
Sq Ft
$137/Sq Ft
Est. Value
About This Home
This home is located at 13652 Oakbrook Dr, North Royalton, OH 44133 and is currently estimated at $170,667, approximately $136 per square foot. 13652 Oakbrook Dr is a home located in Cuyahoga County with nearby schools including North Royalton Middle School, North Royalton High School, and Royal Redeemer Lutheran School.
Ownership History
Date
Name
Owned For
Owner Type
Purchase Details
Closed on
Apr 29, 2002
Sold by
Simko Lisa A
Bought by
Simko William A
Current Estimated Value
Home Financials for this Owner
Home Financials are based on the most recent Mortgage that was taken out on this home.
Original Mortgage
$60,000
Outstanding Balance
$25,585
Interest Rate
7.07%
Estimated Equity
$145,082
Purchase Details
Closed on
Mar 24, 1993
Sold by
Forestek Ralph J
Bought by
Simko William A
Purchase Details
Closed on
Jan 18, 1990
Sold by
Mocarski Bernard F
Bought by
Forestek Ralph J
Purchase Details
Closed on
Feb 29, 1988
Sold by
Reddish Debra A
Bought by
Mocarski Bernard F
Purchase Details
Closed on
Sep 8, 1983
Sold by
Banach Patricia A
Bought by
Reddish Debra A
Purchase Details
Closed on
Jan 25, 1979
Sold by
Kwasek Mathew V and D L
Bought by
Banach Patricia A
Purchase Details
Closed on
Jan 1, 1977
Bought by
Kwasek Mathew and D L
Create a Home Valuation Report for This Property
The Home Valuation Report is an in-depth analysis detailing your home's value as well as a comparison with similar homes in the area
Home Values in the Area
Average Home Value in this Area
Purchase History
| Date | Buyer | Sale Price | Title Company |
|---|---|---|---|
| Simko William A | -- | Northcoast Title Agency | |
| Simko William A | $62,000 | -- | |
| Forestek Ralph J | -- | -- | |
| Forestek Ralph J | -- | -- | |
| Mocarski Bernard F | $52,000 | -- | |
| Reddish Debra A | $47,000 | -- | |
| Banach Patricia A | $47,000 | -- | |
| Kwasek Mathew | -- | -- |
Source: Public Records
Mortgage History
| Date | Status | Borrower | Loan Amount |
|---|---|---|---|
| Open | Simko William A | $60,000 |
Source: Public Records
Tax History Compared to Growth
Tax History
| Year | Tax Paid | Tax Assessment Tax Assessment Total Assessment is a certain percentage of the fair market value that is determined by local assessors to be the total taxable value of land and additions on the property. | Land | Improvement |
|---|---|---|---|---|
| 2024 | $2,830 | $48,720 | $4,655 | $44,065 |
| 2023 | $1,975 | $31,190 | $3,150 | $28,040 |
| 2022 | $1,962 | $31,185 | $3,150 | $28,035 |
| 2021 | $1,983 | $31,190 | $3,150 | $28,040 |
| 2020 | $1,580 | $23,630 | $2,380 | $21,250 |
| 2019 | $1,534 | $67,500 | $6,800 | $60,700 |
| 2018 | $1,451 | $23,630 | $2,380 | $21,250 |
| 2017 | $1,443 | $21,000 | $2,100 | $18,900 |
| 2016 | $1,352 | $21,000 | $2,100 | $18,900 |
| 2015 | $1,704 | $21,000 | $2,100 | $18,900 |
| 2014 | $1,704 | $26,260 | $2,630 | $23,630 |
Source: Public Records
Map
Nearby Homes
- 12906 Cartwright Pkwy
- 13000 Cartwright Pkwy
- 13831 Woodcroft Trace
- S/L Margaret Dr
- 7554 Margaret Dr
- 7595 Margaret Dr
- 7545 Margaret Dr
- 7585 Margaret Dr
- 7575 Margaret Dr
- 7535 Margaret Dr
- 7555 Margaret Dr
- 7600 Margaret Dr
- 7564 Margaret Dr
- 7574 Margaret Dr
- 12701 Gordon St
- 8381 N Akins Rd Unit H7
- 9035 Wallings Rd
- 7332 Creekwood Dr Unit 4B
- 11550 York Rd
- 9611 Sunrise Blvd Unit K2
- 13656 Oakbrook Dr Unit 3656
- 13658 Oakbrook Dr Unit 3658
- 13654 Oakbrook Dr
- 13642 Oakbrook Dr Unit 3642
- 13646 Oakbrook Dr Unit 3646
- 13648 Oakbrook Dr
- 13644 Oakbrook Dr
- 13668 Oakbrook Dr Unit 3668
- 13664 Oakbrook Dr Unit 3664
- 13662 Oakbrook Dr
- 13666 Oakbrook Dr
- 13666 Oakbrook Dr Unit 3666
- 13676 Oakbrook Dr Unit 3676
- 13672 Oakbrook Dr Unit 3672
- 13678 Oakbrook Dr
- 13674 Oakbrook Dr Unit 3674
- 13632 Oakbrook Dr Unit 3632
- 13634 Oakbrook Dr
- 13638 Oakbrook Dr
- 13636 Oakbrook Dr