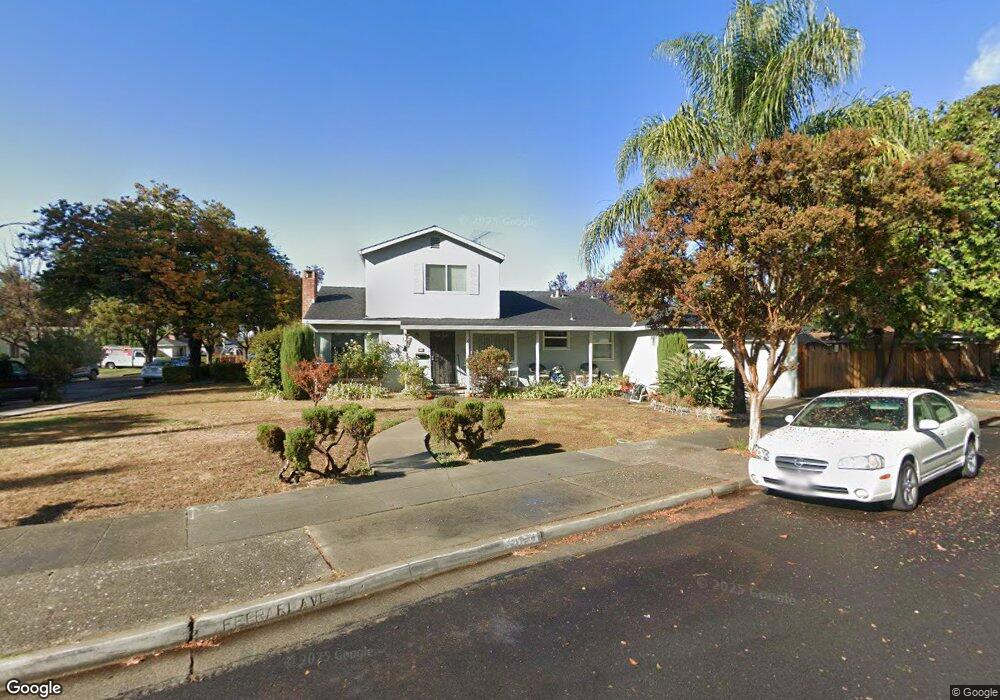
137 Ferrari Ave San Jose, CA 95110
Estimated Value: $717,000 - $1,310,000
5
Beds
2
Baths
1,566
Sq Ft
$721/Sq Ft
Est. Value
About This Home
This home is located at 137 Ferrari Ave, San Jose, CA 95110 and is currently estimated at $1,128,937, approximately $720 per square foot. 137 Ferrari Ave is a home located in Santa Clara County with nearby schools including Muwekma Ohlone Middle, Abraham Lincoln High, and Walter L. Bachrodt Elementary School.
Ownership History
Date
Name
Owned For
Owner Type
Purchase Details
Closed on
Sep 27, 2024
Sold by
Bado Russell David and Bado Leticia Santos
Bought by
Bado Family Trust and Bado
Current Estimated Value
Purchase Details
Closed on
Mar 17, 2000
Sold by
Et Bado Silvestre F And Gloria V Trust
Bought by
Bado Russell David and Bado Leticia Santos
Purchase Details
Closed on
May 14, 1999
Sold by
Et Bado Silvestre F And Gloria V Trust
Bought by
Bado Silverstre F and Bado Gloria
Home Financials for this Owner
Home Financials are based on the most recent Mortgage that was taken out on this home.
Original Mortgage
$85,000
Interest Rate
6.86%
Mortgage Type
Credit Line Revolving
Purchase Details
Closed on
Aug 15, 1994
Sold by
Vibanco Pelagio and Vibanco Baldomera
Bought by
Bado Silvestre F and Bado Gloria Vibanco
Create a Home Valuation Report for This Property
The Home Valuation Report is an in-depth analysis detailing your home's value as well as a comparison with similar homes in the area
Home Values in the Area
Average Home Value in this Area
Purchase History
| Date | Buyer | Sale Price | Title Company |
|---|---|---|---|
| Bado Family Trust | -- | None Listed On Document | |
| Bado Russell David | -- | Fidelity National Title Co | |
| Bado Silverstre F | $42,500 | Old Republic Title Company | |
| Bado Silvestre F | -- | -- |
Source: Public Records
Mortgage History
| Date | Status | Borrower | Loan Amount |
|---|---|---|---|
| Previous Owner | Bado Silverstre F | $85,000 |
Source: Public Records
Tax History Compared to Growth
Tax History
| Year | Tax Paid | Tax Assessment Tax Assessment Total Assessment is a certain percentage of the fair market value that is determined by local assessors to be the total taxable value of land and additions on the property. | Land | Improvement |
|---|---|---|---|---|
| 2025 | $4,614 | $219,066 | $162,294 | $56,772 |
| 2024 | $4,614 | $214,771 | $159,112 | $55,659 |
| 2023 | $4,476 | $210,561 | $155,993 | $54,568 |
| 2022 | $4,418 | $206,434 | $152,935 | $53,499 |
| 2021 | $4,244 | $202,387 | $149,937 | $52,450 |
| 2020 | $4,039 | $200,313 | $148,400 | $51,913 |
| 2019 | $3,901 | $196,387 | $145,491 | $50,896 |
| 2018 | $3,825 | $192,538 | $142,639 | $49,899 |
| 2017 | $3,770 | $188,764 | $139,843 | $48,921 |
| 2016 | $3,614 | $185,063 | $137,101 | $47,962 |
| 2015 | $3,578 | $182,284 | $135,042 | $47,242 |
| 2014 | $2,772 | $178,714 | $132,397 | $46,317 |
Source: Public Records
Map
Nearby Homes
- 1252 Santa Paula Ave
- 1421 N 1st St Unit 251
- 1107 N 4th St
- 1550 Technology Dr Unit 1072
- 1550 Technology Dr Unit 2036
- 1550 Technology Dr Unit 2119
- 1550 Technology Dr Unit 2112
- 800 N 8th St Unit 311
- 800 N 8th St Unit 120
- 494 Madera Ave
- 521 Santa Ana Ave
- 647 N 2nd St
- 350 E Mission St Unit 211
- 35 George St
- 520 Madera Ave
- 1025 N 12th St
- 0 George Blvd Unit HD22141315
- 640 N 2nd St
- 748-3 N 10th St
- 0 E Hedding St
- 137 Ferrari Ave Unit 1
- 1220 N San Pedro St
- 117 Ferrari Ave
- 1226 N San Pedro St
- 130 Ferrari Ave
- 140 Ferrari Ave
- 1213 N San Pedro St
- 1225 Arnold Ave
- 167 Ferrari Ave
- 1221 N San Pedro St
- 1234 N San Pedro St
- 150 Ferrari Ave
- 1229 N San Pedro St
- 1233 Arnold Ave
- 156 Ferrari Ave
- 1242 N San Pedro St
- 1237 N San Pedro St
- 162 Ferrari Ave
- 1241 Arnold Ave
- 1212 Forrestal Ave