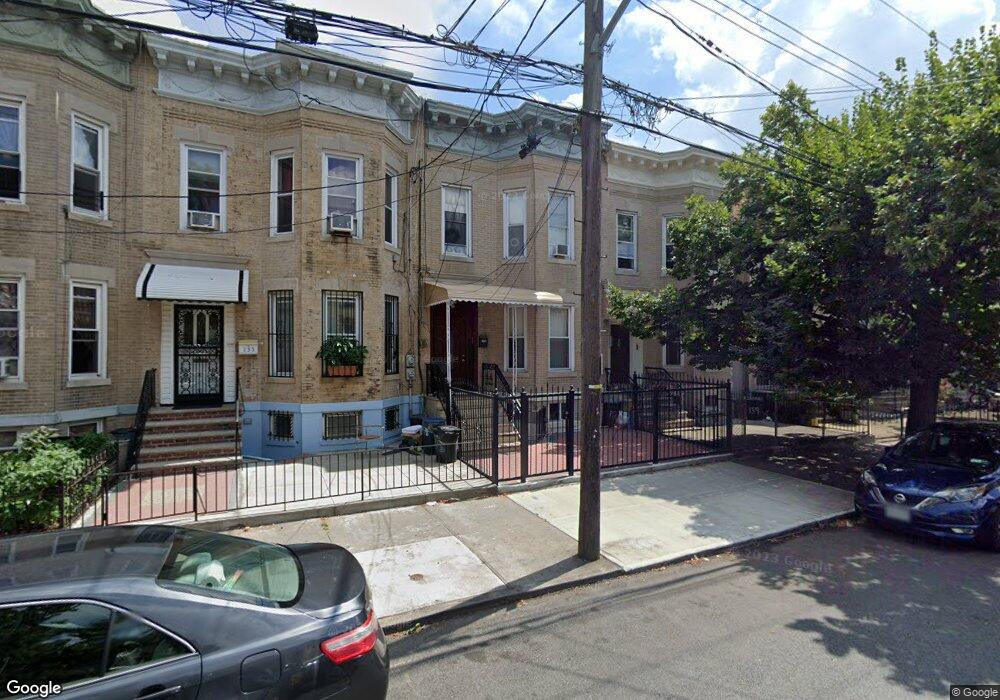
137 Forbell St Brooklyn, NY 11208
East New York NeighborhoodEstimated Value: $878,000 - $1,117,000
--
Bed
--
Bath
2,024
Sq Ft
$508/Sq Ft
Est. Value
About This Home
This home is located at 137 Forbell St, Brooklyn, NY 11208 and is currently estimated at $1,028,333, approximately $508 per square foot. 137 Forbell St is a home located in Kings County with nearby schools including P.S. 214 - Michael Friedsam, Cypress Hills Ascend Charter Lower School, and Brooklyn Scholars Charter School.
Ownership History
Date
Name
Owned For
Owner Type
Purchase Details
Closed on
May 14, 2007
Sold by
Hussain Mahmod and Hussain Md Abul
Bought by
Hussain Md Abul
Current Estimated Value
Purchase Details
Closed on
Jun 30, 1999
Sold by
Hussain Mahmod
Bought by
Hussain Mahmod and Hussain Md Abdul
Create a Home Valuation Report for This Property
The Home Valuation Report is an in-depth analysis detailing your home's value as well as a comparison with similar homes in the area
Home Values in the Area
Average Home Value in this Area
Purchase History
| Date | Buyer | Sale Price | Title Company |
|---|---|---|---|
| Hussain Md Abul | -- | -- | |
| Hussain Md Abul | -- | -- | |
| Hussain Mahmod | -- | Stewart Title Insurance Co | |
| Hussain Mahmod | -- | Stewart Title Insurance Co |
Source: Public Records
Mortgage History
| Date | Status | Borrower | Loan Amount |
|---|---|---|---|
| Closed | Hussain Md Abul | $0 |
Source: Public Records
Tax History Compared to Growth
Tax History
| Year | Tax Paid | Tax Assessment Tax Assessment Total Assessment is a certain percentage of the fair market value that is determined by local assessors to be the total taxable value of land and additions on the property. | Land | Improvement |
|---|---|---|---|---|
| 2025 | $2,795 | $59,880 | $17,040 | $42,840 |
| 2024 | $2,795 | $58,560 | $17,040 | $41,520 |
| 2023 | $2,838 | $63,300 | $17,040 | $46,260 |
| 2022 | $3,150 | $54,660 | $17,040 | $37,620 |
| 2021 | $3,138 | $42,180 | $17,040 | $25,140 |
| 2020 | $1,415 | $41,640 | $17,040 | $24,600 |
| 2019 | $5,884 | $41,640 | $17,040 | $24,600 |
| 2018 | $5,552 | $28,696 | $12,519 | $16,177 |
| 2017 | $5,550 | $28,696 | $13,979 | $14,717 |
| 2016 | $5,127 | $27,199 | $16,296 | $10,903 |
| 2015 | $3,265 | $26,080 | $16,938 | $9,142 |
| 2014 | $3,265 | $24,606 | $17,379 | $7,227 |
Source: Public Records
Map
Nearby Homes