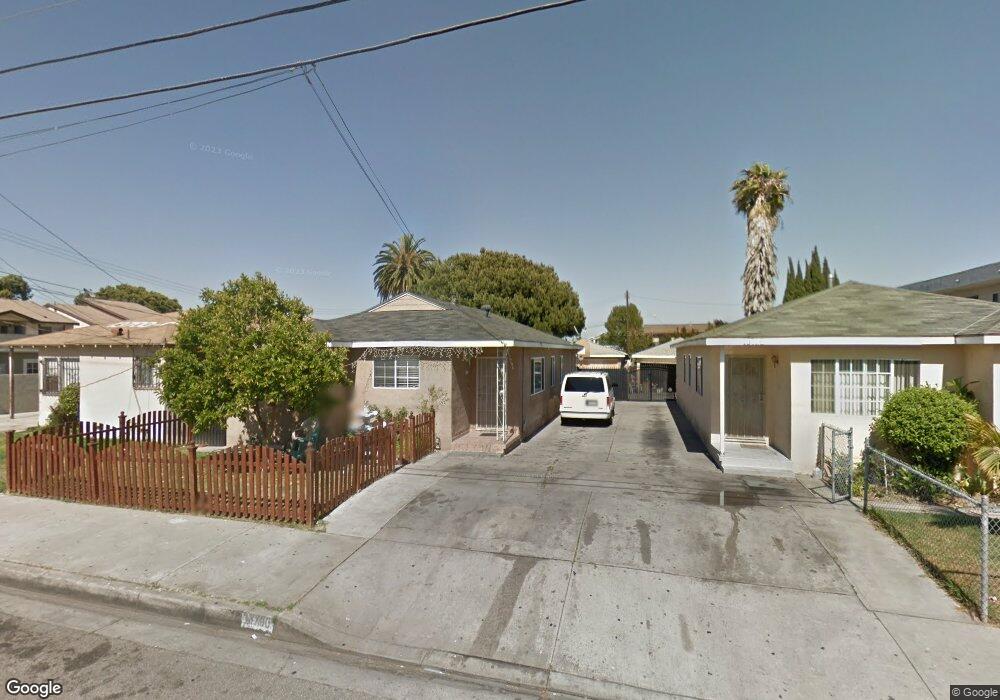
13706 Cerise Ave Hawthorne, CA 90250
Estimated Value: $757,000 - $874,000
4
Beds
2
Baths
1,412
Sq Ft
$574/Sq Ft
Est. Value
About This Home
This home is located at 13706 Cerise Ave, Hawthorne, CA 90250 and is currently estimated at $810,125, approximately $573 per square foot. 13706 Cerise Ave is a home located in Los Angeles County with nearby schools including Zela Davis Elementary School, Bud Carson Middle School, and Leuzinger High School.
Ownership History
Date
Name
Owned For
Owner Type
Purchase Details
Closed on
Dec 5, 2000
Sold by
Fillett Elvira
Bought by
Figueroa Javier and Figueroa Maria J
Current Estimated Value
Home Financials for this Owner
Home Financials are based on the most recent Mortgage that was taken out on this home.
Original Mortgage
$160,550
Interest Rate
7.54%
Purchase Details
Closed on
Mar 1, 1995
Sold by
Emc Mtg Corp
Bought by
Fillet Elvira and Poou Juana
Home Financials for this Owner
Home Financials are based on the most recent Mortgage that was taken out on this home.
Original Mortgage
$124,200
Interest Rate
8.77%
Purchase Details
Closed on
Dec 1, 1993
Sold by
Great Western Bank Fsb
Bought by
Emc Mtg Corp
Purchase Details
Closed on
Sep 8, 1993
Sold by
California Reconveyance Company
Bought by
Great Western Bank Fsb
Create a Home Valuation Report for This Property
The Home Valuation Report is an in-depth analysis detailing your home's value as well as a comparison with similar homes in the area
Home Values in the Area
Average Home Value in this Area
Purchase History
| Date | Buyer | Sale Price | Title Company |
|---|---|---|---|
| Figueroa Javier | $169,000 | Fidelity National Title Co | |
| Fillet Elvira | $138,000 | Fidelity National Title Ins | |
| Emc Mtg Corp | $98,000 | Fidelity National Title | |
| Great Western Bank Fsb | $98,699 | Chicago Title Company |
Source: Public Records
Mortgage History
| Date | Status | Borrower | Loan Amount |
|---|---|---|---|
| Previous Owner | Figueroa Javier | $160,550 | |
| Previous Owner | Fillet Elvira | $124,200 |
Source: Public Records
Tax History Compared to Growth
Tax History
| Year | Tax Paid | Tax Assessment Tax Assessment Total Assessment is a certain percentage of the fair market value that is determined by local assessors to be the total taxable value of land and additions on the property. | Land | Improvement |
|---|---|---|---|---|
| 2025 | $3,521 | $254,631 | $164,232 | $90,399 |
| 2024 | $3,521 | $249,639 | $161,012 | $88,627 |
| 2023 | $3,404 | $244,745 | $157,855 | $86,890 |
| 2022 | $3,445 | $239,947 | $154,760 | $85,187 |
| 2021 | $3,395 | $235,243 | $151,726 | $83,517 |
| 2020 | $3,385 | $232,832 | $150,171 | $82,661 |
| 2019 | $3,283 | $228,268 | $147,227 | $81,041 |
| 2018 | $3,081 | $223,793 | $144,341 | $79,452 |
| 2016 | $2,935 | $215,105 | $138,737 | $76,368 |
| 2015 | $2,871 | $211,875 | $136,654 | $75,221 |
| 2014 | $2,861 | $207,726 | $133,978 | $73,748 |
Source: Public Records
Map
Nearby Homes
- 3512 W 135th St
- 14002 Cerise Ave Unit 11
- 14012 Cerise Ave Unit 3
- 3353 W 135th St
- 13717 Chadron Ave
- 14050 Lemoli Way
- 13945 Lemoli Ave
- 3357 W 134th Place
- 14026 Lemoli Ave Unit C
- 14110 Yukon Ave
- 3506 W 133rd St
- 3609 W 144th St
- 14405 Cerise Ave Unit 35
- 3237 W 132nd St
- 14324 Chadron Ave
- 13534 Cordary Ave Unit 14
- 14540 Yukon Ave
- 14526 Chadron Ave
- 13228 S Wilkie Ave
- 2817 W 146th St
- 13708 Cerise Ave
- 13632 -36 Cerise Ave
- 13636 Cerise Ave Unit 1/2
- 13636 1/2 Cerise Ave
- 13636 Cerise Ave
- 13634 1/2 Cerise Ave
- 13632 Cerise Ave Unit 1/2
- 13634 Cerise Ave
- 13632 1/2 Cerise Ave
- 13632 Cerise Ave
- 13707 Cerise Ave
- 13724 Cerise Ave
- 13722 Cerise Ave Unit 5
- 13734 Cerise Ave
- 13732 Cerise Ave
- 13730 Cerise Ave
- 13728 Cerise Ave
- 13726 Cerise Ave
- 13720 Cerise Ave
- 13718 Cerise Ave