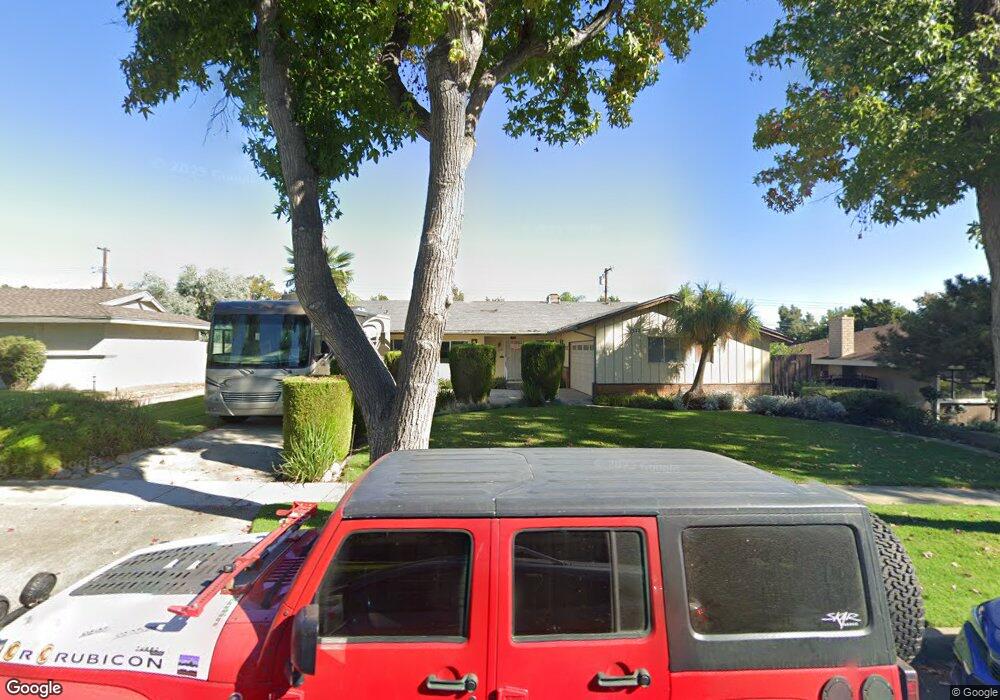
1372 N 2nd Ave Upland, CA 91786
Estimated Value: $865,623 - $899,000
4
Beds
3
Baths
2,134
Sq Ft
$414/Sq Ft
Est. Value
About This Home
This home is located at 1372 N 2nd Ave, Upland, CA 91786 and is currently estimated at $883,906, approximately $414 per square foot. 1372 N 2nd Ave is a home located in San Bernardino County with nearby schools including Sierra Vista Elementary School, Upland Junior High School, and Upland High School.
Ownership History
Date
Name
Owned For
Owner Type
Purchase Details
Closed on
Dec 15, 2014
Sold by
Casa Health Care Inc
Bought by
Rosa Property Management Inc
Current Estimated Value
Purchase Details
Closed on
May 20, 2008
Sold by
Ramirez Rosa
Bought by
Casa Health Care Inc
Purchase Details
Closed on
Apr 20, 1998
Sold by
Sanchez Miriam
Bought by
Ramirez Lawrence R and Ramirez Rosa
Purchase Details
Closed on
Feb 10, 1998
Sold by
Ramirez Lawrence R and Ramirez Rosa
Bought by
Sanchez Miriam
Purchase Details
Closed on
Aug 14, 1997
Sold by
Moody Doyle and Moody Alice M
Bought by
Ramirez Lawrence R and Ramirez Rosa
Home Financials for this Owner
Home Financials are based on the most recent Mortgage that was taken out on this home.
Original Mortgage
$147,342
Interest Rate
7.43%
Mortgage Type
FHA
Purchase Details
Closed on
Oct 25, 1994
Sold by
Jones Terry and Jones Susan
Bought by
Moody Doyle and Moody Alice M
Create a Home Valuation Report for This Property
The Home Valuation Report is an in-depth analysis detailing your home's value as well as a comparison with similar homes in the area
Home Values in the Area
Average Home Value in this Area
Purchase History
| Date | Buyer | Sale Price | Title Company |
|---|---|---|---|
| Rosa Property Management Inc | -- | None Available | |
| Casa Health Care Inc | -- | None Available | |
| Ramirez Lawrence R | -- | -- | |
| Sanchez Miriam | -- | -- | |
| Ramirez Lawrence R | $150,000 | Universal Title Company | |
| Moody Doyle | -- | Union Land Title Company |
Source: Public Records
Mortgage History
| Date | Status | Borrower | Loan Amount |
|---|---|---|---|
| Previous Owner | Ramirez Lawrence R | $147,342 |
Source: Public Records
Tax History Compared to Growth
Tax History
| Year | Tax Paid | Tax Assessment Tax Assessment Total Assessment is a certain percentage of the fair market value that is determined by local assessors to be the total taxable value of land and additions on the property. | Land | Improvement |
|---|---|---|---|---|
| 2025 | $5,820 | $540,833 | $189,893 | $350,940 |
| 2024 | $5,820 | $530,229 | $186,170 | $344,059 |
| 2023 | $5,732 | $519,833 | $182,520 | $337,313 |
| 2022 | $5,609 | $509,640 | $178,941 | $330,699 |
| 2021 | $5,603 | $499,647 | $175,432 | $324,215 |
| 2020 | $5,451 | $494,524 | $173,633 | $320,891 |
| 2019 | $5,433 | $484,827 | $170,228 | $314,599 |
| 2018 | $5,300 | $475,320 | $166,890 | $308,430 |
| 2017 | $5,148 | $466,000 | $163,618 | $302,382 |
| 2016 | $4,928 | $456,863 | $160,410 | $296,453 |
| 2015 | $4,816 | $396,449 | $138,221 | $258,228 |
| 2014 | $4,136 | $388,683 | $135,513 | $253,170 |
Source: Public Records
Map
Nearby Homes
- 1361 N 3rd Ave
- 1346 N Euclid Ave
- 1404 N Euclid Ave
- 1377 N 5th Ave
- 1188 N 3rd Ave
- 1477 Winston Ct
- 1234 N Laurel Ave
- 368 West St
- 388 Harford Place
- 719 Valadez St
- 922 N 4th Ave
- 929 E Foothill Blvd Unit 91
- 929 E Foothill Blvd
- 929 E Foothill Blvd Unit 23
- 929 E Foothill Blvd Unit 187
- 928 N Redding Way Unit D
- 1618 Winston Way
- 910 N Redding Way Unit F
- 855 N Palm Ave
- 506 E 11th St
- 1376 N 2nd Ave
- 1366 N 2nd Ave
- 1371 N Shelley Ave
- 1384 N 2nd Ave
- 1360 N 2nd Ave
- 1377 N Shelley Ave
- 1365 N Shelley Ave
- 1373 N 2nd Ave
- 1365 N 2nd Ave
- 1377 N 2nd Ave
- 1383 N Shelley Ave
- 1359 N Shelley Ave
- 1390 N 2nd Ave
- 1354 N 2nd Ave
- 1357 N 2nd Ave
- 1383 N 2nd Ave
- 1389 N Shelley Ave
- 1353 N Shelley Ave
- 1353 N 2nd Ave
- 1391 N 2nd Ave