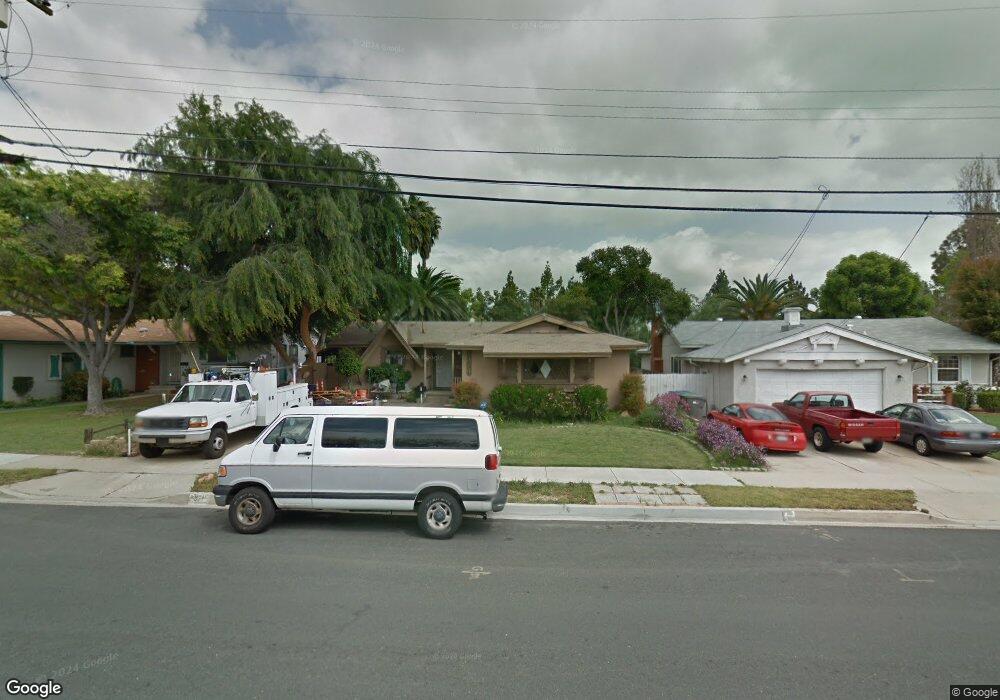
1374 Swallow Dr El Cajon, CA 92020
Fletcher Hills NeighborhoodEstimated Value: $749,000 - $814,741
3
Beds
2
Baths
1,111
Sq Ft
$709/Sq Ft
Est. Value
About This Home
This home is located at 1374 Swallow Dr, El Cajon, CA 92020 and is currently estimated at $788,185, approximately $709 per square foot. 1374 Swallow Dr is a home located in San Diego County with nearby schools including Flying Hills Elementary School, West Hills High School, and Grossmont Secondary School.
Ownership History
Date
Name
Owned For
Owner Type
Purchase Details
Closed on
Oct 8, 2017
Sold by
Kazules Kevin and Kazules Amanda Hill
Bought by
Kazules Kevin Joseph and Kazules Amanda Michele Hill
Current Estimated Value
Purchase Details
Closed on
Sep 17, 2014
Sold by
Buffington Michael B and Buffington Adele G
Bought by
Kazules Kevin and Kazules Amanda
Home Financials for this Owner
Home Financials are based on the most recent Mortgage that was taken out on this home.
Original Mortgage
$367,650
Outstanding Balance
$280,835
Interest Rate
4.08%
Mortgage Type
New Conventional
Estimated Equity
$507,350
Purchase Details
Closed on
Jun 11, 2014
Sold by
Getz George R
Bought by
Buffington Michael B and Buffington Adele G
Purchase Details
Closed on
May 9, 2002
Sold by
Getz George R and Getz Melbalena J
Bought by
Getz George R and Getz Melbalena J
Create a Home Valuation Report for This Property
The Home Valuation Report is an in-depth analysis detailing your home's value as well as a comparison with similar homes in the area
Home Values in the Area
Average Home Value in this Area
Purchase History
| Date | Buyer | Sale Price | Title Company |
|---|---|---|---|
| Kazules Kevin Joseph | -- | None Available | |
| Kazules Kevin | $387,000 | Lawyers Title | |
| Buffington Michael B | $225,000 | Lawyers Title Company | |
| Getz George R | -- | -- |
Source: Public Records
Mortgage History
| Date | Status | Borrower | Loan Amount |
|---|---|---|---|
| Open | Kazules Kevin | $367,650 |
Source: Public Records
Tax History Compared to Growth
Tax History
| Year | Tax Paid | Tax Assessment Tax Assessment Total Assessment is a certain percentage of the fair market value that is determined by local assessors to be the total taxable value of land and additions on the property. | Land | Improvement |
|---|---|---|---|---|
| 2025 | $6,662 | $465,107 | $224,740 | $240,367 |
| 2024 | $6,662 | $455,988 | $220,334 | $235,654 |
| 2023 | $6,461 | $447,048 | $216,014 | $231,034 |
| 2022 | $6,494 | $438,283 | $211,779 | $226,504 |
| 2021 | $6,344 | $429,690 | $207,627 | $222,063 |
| 2020 | $6,030 | $425,286 | $205,499 | $219,787 |
| 2019 | $5,022 | $416,948 | $201,470 | $215,478 |
| 2018 | $4,939 | $408,773 | $197,520 | $211,253 |
| 2017 | $4,960 | $400,759 | $193,648 | $207,111 |
| 2016 | $4,762 | $392,901 | $189,851 | $203,050 |
| 2015 | $4,738 | $387,000 | $187,000 | $200,000 |
| 2014 | $615 | $54,418 | $18,068 | $36,350 |
Source: Public Records
Map
Nearby Homes
- 1340 Heron Ave
- 1677 Heron Ave
- 0 Hacienda Dr
- 2052 Flying Hills Ln
- 731 Dewane Dr
- 741 N Pierce St
- 1387 Weers St
- 2106 Windmill View Rd
- 701 El Monte Rd
- 1958 Milford Place
- 2161 Puesta Place
- 2148 Estela Dr
- 2527 Gibbons St
- 1951 Belmore Ct
- 589 N Johnson Ave Unit 247
- 589 N Johnson Ave Unit 130
- 370 N Cuyamaca St
- 2528 Windmill View Rd
- 1673 Hillsmont Dr
- 1681 Hillsmont Dr
- 1386 Swallow Dr
- 1362 Swallow Dr
- 1402 Falcon Ln
- 1398 Swallow Dr
- 1354 Swallow Dr
- 1396 Bluebird St
- 1414 Swallow Dr
- 1346 Swallow Dr
- 1399 Dove St
- 1384 Bluebird St
- 1399 Bluebird St
- 1334 Swallow Dr
- 1426 Swallows
- 1426 Swallow Dr
- 1387 Dove St
- 1446 Falcon Ln
- 1387 Bluebird St
- 1372 Bluebird St
- 1322 Swallow Dr
- 1438 Swallow Dr