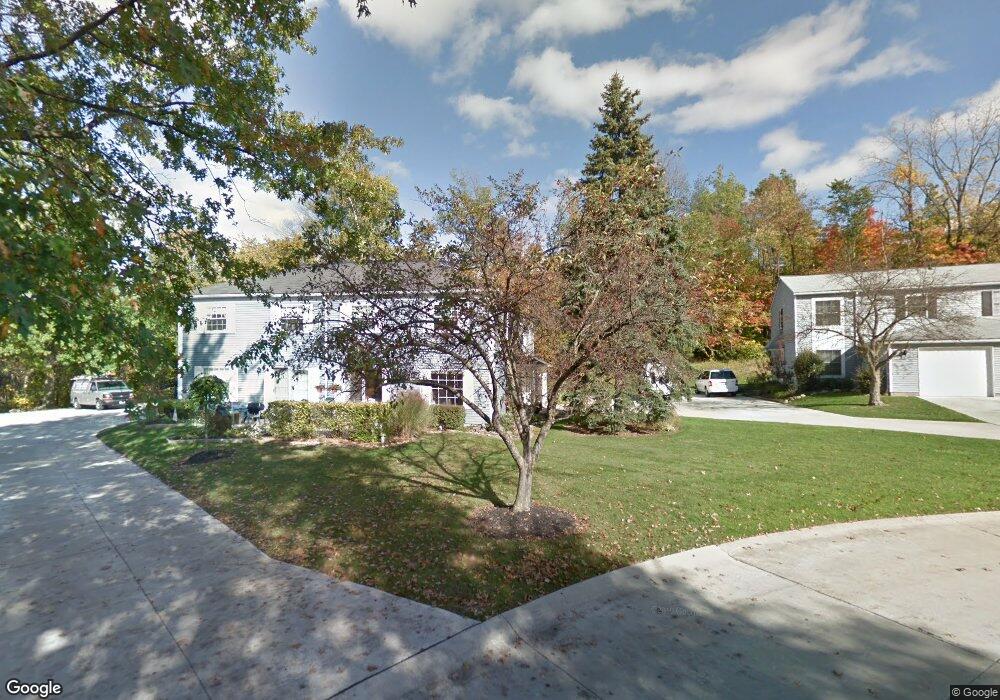
13746 Oakbrook Dr Unit 3746 North Royalton, OH 44133
Estimated Value: $162,781 - $182,000
3
Beds
2
Baths
1,148
Sq Ft
$149/Sq Ft
Est. Value
About This Home
This home is located at 13746 Oakbrook Dr Unit 3746, North Royalton, OH 44133 and is currently estimated at $171,195, approximately $149 per square foot. 13746 Oakbrook Dr Unit 3746 is a home located in Cuyahoga County with nearby schools including North Royalton Middle School, North Royalton High School, and Royal Redeemer Lutheran School.
Ownership History
Date
Name
Owned For
Owner Type
Purchase Details
Closed on
Jun 29, 2010
Sold by
Kinley Mary E
Bought by
Ballentine Barbara A
Current Estimated Value
Home Financials for this Owner
Home Financials are based on the most recent Mortgage that was taken out on this home.
Original Mortgage
$50,000
Outstanding Balance
$33,638
Interest Rate
4.97%
Mortgage Type
Purchase Money Mortgage
Estimated Equity
$137,557
Purchase Details
Closed on
Jul 31, 1996
Sold by
Lepi Catherine B
Bought by
Kinley Mary E
Home Financials for this Owner
Home Financials are based on the most recent Mortgage that was taken out on this home.
Original Mortgage
$64,000
Interest Rate
8.33%
Mortgage Type
New Conventional
Purchase Details
Closed on
Jan 1, 1977
Bought by
Lepi Catherine B
Create a Home Valuation Report for This Property
The Home Valuation Report is an in-depth analysis detailing your home's value as well as a comparison with similar homes in the area
Home Values in the Area
Average Home Value in this Area
Purchase History
| Date | Buyer | Sale Price | Title Company |
|---|---|---|---|
| Ballentine Barbara A | $76,500 | Signature Title | |
| Kinley Mary E | $80,000 | -- | |
| Lepi Catherine B | -- | -- |
Source: Public Records
Mortgage History
| Date | Status | Borrower | Loan Amount |
|---|---|---|---|
| Open | Ballentine Barbara A | $50,000 | |
| Previous Owner | Kinley Mary E | $64,000 |
Source: Public Records
Tax History Compared to Growth
Tax History
| Year | Tax Paid | Tax Assessment Tax Assessment Total Assessment is a certain percentage of the fair market value that is determined by local assessors to be the total taxable value of land and additions on the property. | Land | Improvement |
|---|---|---|---|---|
| 2024 | $1,877 | $42,105 | $4,585 | $37,520 |
| 2023 | $1,401 | $31,290 | $3,150 | $28,140 |
| 2022 | $1,418 | $31,290 | $3,150 | $28,140 |
| 2021 | $1,433 | $31,290 | $3,150 | $28,140 |
| 2020 | $1,000 | $23,700 | $2,380 | $21,320 |
| 2019 | $971 | $67,700 | $6,800 | $60,900 |
| 2018 | $981 | $23,700 | $2,380 | $21,320 |
| 2017 | $871 | $21,430 | $2,560 | $18,870 |
| 2016 | $816 | $21,430 | $2,560 | $18,870 |
| 2015 | $1,738 | $21,430 | $2,560 | $18,870 |
| 2014 | $1,738 | $26,780 | $3,190 | $23,590 |
Source: Public Records
Map
Nearby Homes
- 13831 Woodcroft Trace
- 12906 Cartwright Pkwy
- 13000 Cartwright Pkwy
- 8381 N Akins Rd Unit H7
- S/L Margaret Dr
- 7554 Margaret Dr
- 7595 Margaret Dr
- 7545 Margaret Dr
- 7585 Margaret Dr
- 7575 Margaret Dr
- 7535 Margaret Dr
- 7555 Margaret Dr
- 7600 Margaret Dr
- 7564 Margaret Dr
- 7574 Margaret Dr
- 12701 Gordon St
- 7332 Creekwood Dr Unit 4B
- 9035 Wallings Rd
- 7400 Akins Rd
- 11550 York Rd
- 13744 Oakbrook Dr Unit 3744
- 13748 Oakbrook Dr
- 13742 Oakbrook Dr
- 13742 Oakbrook Dr Unit 3742
- 13667 Woodcroft Trace
- 13758 Oakbrook Dr Unit 3758
- 13754 Oakbrook Dr Unit 3754
- 13752 Oakbrook Dr
- 13756 Oakbrook Dr
- 13734 Oakbrook Dr Unit 3734
- 13732 Oakbrook Dr Unit 3732
- 13736 Oakbrook Dr
- 13663 Woodcroft Trace
- 13659 Woodcroft Trace
- 13655 Woodcroft Trace
- 13651 Woodcroft Trace
- 13726 Oakbrook Dr Unit 3726
- 13722 Oakbrook Dr Unit 3722
- 13728 Oakbrook Dr
- 13724 Oakbrook Dr