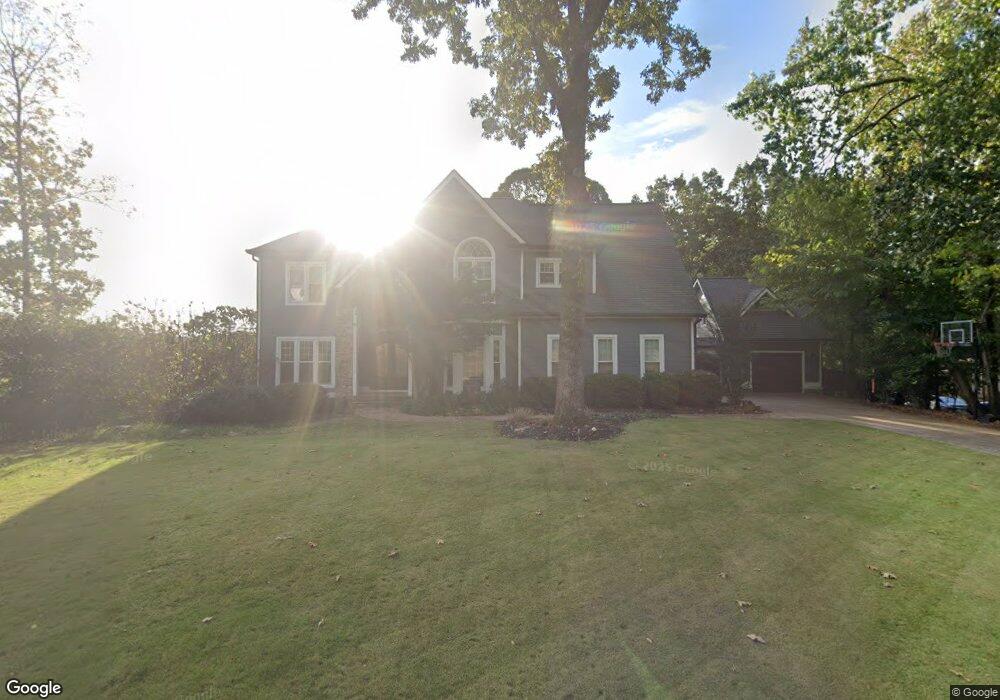
138 Windalier Ridge Peachtree City, GA 30269
Estimated Value: $784,000 - $1,101,000
--
Bed
--
Bath
2,982
Sq Ft
$296/Sq Ft
Est. Value
About This Home
This home is located at 138 Windalier Ridge, Peachtree City, GA 30269 and is currently estimated at $881,719, approximately $295 per square foot. 138 Windalier Ridge is a home located in Fayette County with nearby schools including Kedron Elementary School, Booth Middle School, and McIntosh High School.
Ownership History
Date
Name
Owned For
Owner Type
Purchase Details
Closed on
Jul 28, 2023
Sold by
Gillispie Christopher S and Gillispie Tiffany N
Bought by
Christopher And Tiffany Gillispie Living Trus and Gillispie
Current Estimated Value
Purchase Details
Closed on
Aug 25, 2016
Sold by
Meyer Hans J and Meyer Karin
Bought by
Gillispie Christopher and Gillispie Tiffany
Home Financials for this Owner
Home Financials are based on the most recent Mortgage that was taken out on this home.
Original Mortgage
$516,000
Interest Rate
3.48%
Purchase Details
Closed on
Aug 18, 1993
Sold by
Legary Bldrs
Bought by
Meyer Hans J and Meyer Karin
Home Financials for this Owner
Home Financials are based on the most recent Mortgage that was taken out on this home.
Original Mortgage
$201,050
Interest Rate
7.18%
Create a Home Valuation Report for This Property
The Home Valuation Report is an in-depth analysis detailing your home's value as well as a comparison with similar homes in the area
Home Values in the Area
Average Home Value in this Area
Purchase History
| Date | Buyer | Sale Price | Title Company |
|---|---|---|---|
| Christopher And Tiffany Gillispie Living Trus | -- | None Listed On Document | |
| Gillispie Christopher | $575,000 | -- | |
| Meyer Hans J | $251,400 | -- |
Source: Public Records
Mortgage History
| Date | Status | Borrower | Loan Amount |
|---|---|---|---|
| Previous Owner | Gillispie Christopher | $516,000 | |
| Previous Owner | Meyer Hans J | $201,050 |
Source: Public Records
Tax History Compared to Growth
Tax History
| Year | Tax Paid | Tax Assessment Tax Assessment Total Assessment is a certain percentage of the fair market value that is determined by local assessors to be the total taxable value of land and additions on the property. | Land | Improvement |
|---|---|---|---|---|
| 2024 | $7,240 | $296,572 | $38,000 | $258,572 |
| 2023 | $6,510 | $266,320 | $38,000 | $228,320 |
| 2022 | $6,746 | $251,600 | $38,000 | $213,600 |
| 2021 | $6,262 | $210,560 | $34,200 | $176,360 |
| 2020 | $6,578 | $213,800 | $34,200 | $179,600 |
| 2019 | $6,577 | $211,720 | $34,200 | $177,520 |
| 2018 | $6,330 | $200,640 | $34,200 | $166,440 |
| 2017 | $6,108 | $192,400 | $34,200 | $158,200 |
| 2016 | $5,889 | $178,840 | $34,200 | $144,640 |
| 2015 | $5,562 | $166,280 | $34,200 | $132,080 |
| 2014 | $5,206 | $153,120 | $34,200 | $118,920 |
| 2013 | -- | $151,520 | $0 | $0 |
Source: Public Records
Map
Nearby Homes
- 107 Rolling Green
- 833 Southern Shore Dr
- 606 Wingspread
- 522 Golf View Dr
- 522 Golfview Dr
- 109 Peninsula Dr
- 200 Doe Run
- 718 Avalon Way
- 311 Longer Dr
- 221 N Cove Dr
- 101 Parkway Dr
- 108 Madison Ave
- 115 Stonington Dr
- 103 Creek Bed Ct
- 504 Telfair Park
- 330 N Peachtree Pkwy
- 134 Mellington Ln
- 112 Bridgewater Dr
- 15 Perthshire Dr
- 132 Sea Island Dr
- 136 Windalier Ridge Unit 1
- 136 Windalier Ridge
- 500 Gallery Place
- 502 Gallery Place Unit 1
- 504 Gallery Place
- 504 Gallery Place Unit 5
- 506 Gallery Place
- 135 Windalier Ridge
- 801 Southern Shore Dr
- 134 Windalier Ridge
- 0 Gallery Place Unit 8601274
- 0 Gallery Place Unit 8215394
- 0 Gallery Place Unit 8834849
- 0 Gallery Place Unit 3255185
- 0 Gallery Place Unit 7196683
- 0 Gallery Place Unit 7638133
- 0 Gallery Place Unit 8004040
- 0 Gallery Place Unit 8019791
- 403 Henredon Hill
- 133 Windalier Ridge Unit 36