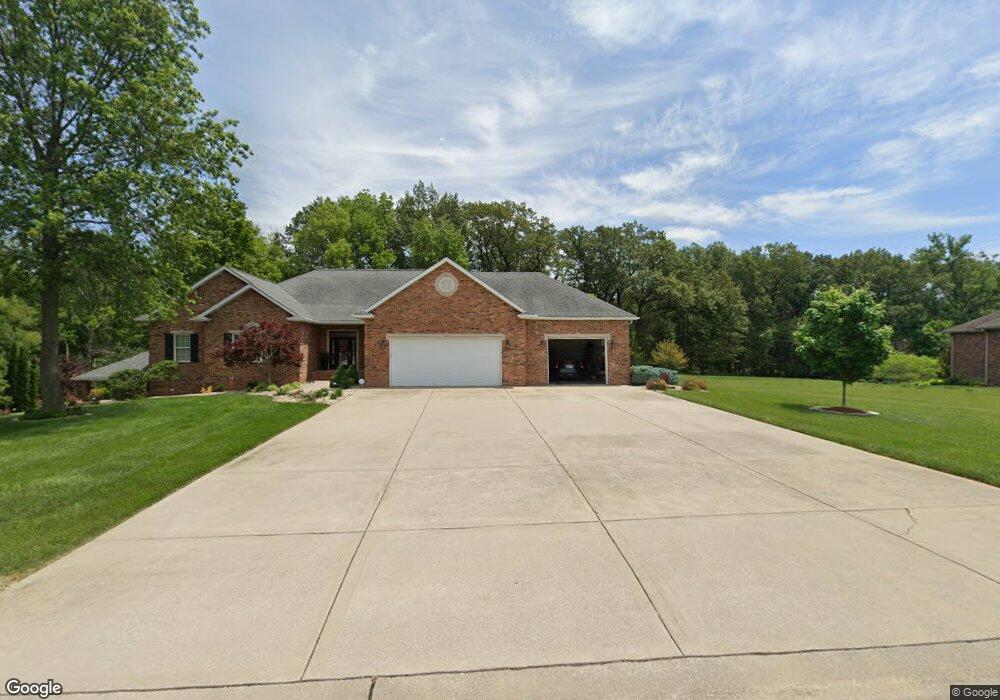
138 Wyndrose Estates Dr Belleville, IL 62226
Estimated Value: $420,000 - $654,000
5
Beds
4
Baths
2,900
Sq Ft
$189/Sq Ft
Est. Value
About This Home
This home is located at 138 Wyndrose Estates Dr, Belleville, IL 62226 and is currently estimated at $547,755, approximately $188 per square foot. 138 Wyndrose Estates Dr is a home located in St. Clair County with nearby schools including Millstadt Consolidated School, Millstadt Primary Center, and Governor French Academy.
Ownership History
Date
Name
Owned For
Owner Type
Purchase Details
Closed on
Oct 24, 2017
Sold by
Pesko Kevin M and Pesko Linda A
Bought by
Pesko Kevin M and Kevin M Pesko Declaration Of T
Current Estimated Value
Purchase Details
Closed on
Nov 18, 2010
Sold by
Wessel Bernard J and Wessel Janet
Bought by
Pesko Kevin M and Pesko Linda A
Home Financials for this Owner
Home Financials are based on the most recent Mortgage that was taken out on this home.
Original Mortgage
$248,850
Outstanding Balance
$85,747
Interest Rate
4.27%
Mortgage Type
New Conventional
Estimated Equity
$462,008
Purchase Details
Closed on
Jan 10, 2006
Sold by
Wessel Bernard J
Bought by
Wessel Bernard J and Wessel Janet
Home Financials for this Owner
Home Financials are based on the most recent Mortgage that was taken out on this home.
Original Mortgage
$165,000
Interest Rate
6.42%
Mortgage Type
New Conventional
Create a Home Valuation Report for This Property
The Home Valuation Report is an in-depth analysis detailing your home's value as well as a comparison with similar homes in the area
Home Values in the Area
Average Home Value in this Area
Purchase History
| Date | Buyer | Sale Price | Title Company |
|---|---|---|---|
| Pesko Kevin M | -- | Attorney | |
| Pesko Kevin M | $355,500 | Fatic | |
| Wessel Bernard J | -- | Fatic |
Source: Public Records
Mortgage History
| Date | Status | Borrower | Loan Amount |
|---|---|---|---|
| Open | Pesko Kevin M | $248,850 | |
| Previous Owner | Wessel Bernard J | $165,000 |
Source: Public Records
Tax History Compared to Growth
Tax History
| Year | Tax Paid | Tax Assessment Tax Assessment Total Assessment is a certain percentage of the fair market value that is determined by local assessors to be the total taxable value of land and additions on the property. | Land | Improvement |
|---|---|---|---|---|
| 2024 | $11,102 | $172,552 | $27,387 | $145,165 |
| 2023 | $10,782 | $160,379 | $25,455 | $134,924 |
| 2022 | $10,332 | $147,191 | $23,362 | $123,829 |
| 2021 | $10,105 | $138,598 | $21,998 | $116,600 |
| 2020 | $10,070 | $131,133 | $19,622 | $111,511 |
| 2019 | $9,725 | $131,133 | $19,622 | $111,511 |
| 2018 | $9,509 | $126,540 | $18,935 | $107,605 |
| 2017 | $0 | $120,678 | $18,058 | $102,620 |
| 2016 | $9,294 | $118,306 | $18,373 | $99,933 |
| 2014 | $7,956 | $116,420 | $18,080 | $98,340 |
| 2013 | $7,550 | $118,953 | $18,473 | $100,480 |
Source: Public Records
Map
Nearby Homes
- 178 Wyndrose Estates Dr
- 7168 Mine Haul Rd
- 1909 Menard Dr
- 1824 Menard Dr
- 324 Lake Forest Dr
- 800 Springwood Dr
- 245 Summers Trace
- 6009 Rolling Hills Ln
- 633 Springwood Dr
- 4900 Barnwood Ln
- 4904 Barnwood Ln
- 401 Pecan Ln
- 45 Fenwood Dr
- 6409 Balsam Ridge
- 1374 Rocky Creek Ct
- 6264 Roachtown Rd
- 7400 Concordia Rd
- 1366 Radden Ct
- 33 Forest Gate Dr
- 1500 State Street Rd
- 142 Wyndrose Estates Dr
- 224 Wyndridge Ct
- 139 Wyndrose Estates Dr
- 143 Wyndrose Estates Dr
- 139 Wyndrose Estates Dr
- 143 Wyndrose Estates Dr
- 219 Wyndridge Ct
- 126 Wyndrose Estates Dr
- 146 Wyndrose Estates Dr
- 135 Wyndrose Estates Dr
- 131 Wyndrose Estates Dr
- 147 Wyndrose Estates Dr
- 220 Wyndridge Ct
- 168 Wyndrose Estates Dr
- 215 Wyndridge Ct
- 162 Wyndrose Estates Dr
- 172 Wyndrose Estates Dr
- 151 Wyndrose Estates Dr
- 216 Wyndridge Ct
- 127 Wyndrose Estates Dr