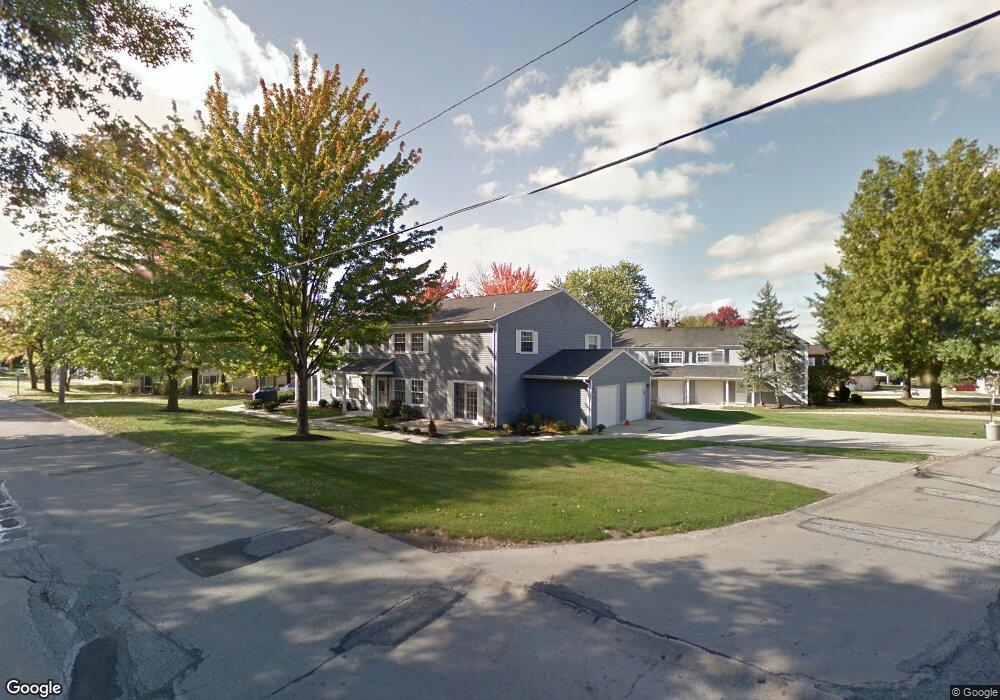
13818 Oakbrook Dr North Royalton, OH 44133
Estimated Value: $130,121 - $180,000
3
Beds
2
Baths
1,148
Sq Ft
$138/Sq Ft
Est. Value
About This Home
This home is located at 13818 Oakbrook Dr, North Royalton, OH 44133 and is currently estimated at $158,280, approximately $137 per square foot. 13818 Oakbrook Dr is a home located in Cuyahoga County with nearby schools including North Royalton Middle School, North Royalton High School, and Royal Redeemer Lutheran School.
Ownership History
Date
Name
Owned For
Owner Type
Purchase Details
Closed on
May 16, 2025
Sold by
Depiero Chris G and Depiero Laura D
Bought by
Depiero Family Trust and Depiero
Current Estimated Value
Purchase Details
Closed on
Sep 12, 2017
Sold by
Depiero Roberta
Bought by
Depiero Chris G and Depiero Laura D
Purchase Details
Closed on
Oct 17, 1991
Sold by
Depiero Gerald A
Bought by
Depiero Gerald A and Depiero Roberta
Purchase Details
Closed on
Apr 3, 1990
Sold by
Depiero Lisa Jo
Bought by
Depiero Gerald A
Purchase Details
Closed on
Sep 11, 1981
Sold by
Hahner Lee D
Bought by
Depiero Lisa Jo
Purchase Details
Closed on
Mar 21, 1978
Sold by
Garlick Frederick A
Bought by
Hahner Lee D
Purchase Details
Closed on
Sep 15, 1976
Sold by
Robinett Charles A
Bought by
Garlick Frederick A
Purchase Details
Closed on
Feb 18, 1976
Sold by
Robinett Chas A and M B
Bought by
Robinett Charles A
Purchase Details
Closed on
Jan 1, 1975
Bought by
Robinett Chas A and M B
Create a Home Valuation Report for This Property
The Home Valuation Report is an in-depth analysis detailing your home's value as well as a comparison with similar homes in the area
Home Values in the Area
Average Home Value in this Area
Purchase History
| Date | Buyer | Sale Price | Title Company |
|---|---|---|---|
| Depiero Family Trust | -- | None Listed On Document | |
| Depiero Chris G | $75,000 | Signature Title | |
| Depiero Gerald A | -- | -- | |
| Depiero Gerald A | -- | -- | |
| Depiero Lisa Jo | $49,000 | -- | |
| Hahner Lee D | $37,500 | -- | |
| Garlick Frederick A | $33,000 | -- | |
| Robinett Charles A | -- | -- | |
| Robinett Chas A | -- | -- |
Source: Public Records
Tax History Compared to Growth
Tax History
| Year | Tax Paid | Tax Assessment Tax Assessment Total Assessment is a certain percentage of the fair market value that is determined by local assessors to be the total taxable value of land and additions on the property. | Land | Improvement |
|---|---|---|---|---|
| 2024 | $2,893 | $48,720 | $4,865 | $43,855 |
| 2023 | $2,181 | $33,710 | $3,360 | $30,350 |
| 2022 | $2,166 | $33,710 | $3,360 | $30,350 |
| 2021 | $2,191 | $33,710 | $3,360 | $30,350 |
| 2020 | $1,748 | $25,550 | $2,560 | $23,000 |
| 2019 | $1,698 | $73,000 | $7,300 | $65,700 |
| 2018 | $1,718 | $25,550 | $2,560 | $23,000 |
| 2017 | $1,470 | $20,900 | $2,100 | $18,800 |
| 2016 | $1,381 | $20,900 | $2,100 | $18,800 |
| 2015 | $1,739 | $20,900 | $2,100 | $18,800 |
| 2014 | $1,739 | $26,120 | $2,630 | $23,490 |
Source: Public Records
Map
Nearby Homes
- 13831 Woodcroft Trace
- 8381 N Akins Rd Unit H7
- 12906 Cartwright Pkwy
- 13000 Cartwright Pkwy
- S/L Margaret Dr
- 7554 Margaret Dr
- 7595 Margaret Dr
- 7545 Margaret Dr
- 7585 Margaret Dr
- 7575 Margaret Dr
- 7535 Margaret Dr
- 7555 Margaret Dr
- 7600 Margaret Dr
- 7564 Margaret Dr
- 7574 Margaret Dr
- 12701 Gordon St
- 7332 Creekwood Dr Unit 4B
- 7400 Akins Rd
- 9035 Wallings Rd
- 9447 Lindberg Dr
- 13818 Oakbrook Dr Unit 3818
- 13812 Oakbrook Dr Unit 3812
- 13816 Oakbrook Dr Unit 3816
- 13814 Oakbrook Dr
- 13812 Oakbrook Dr Unit 8
- 13814 Oakbrook Dr Unit 3814
- 13822 Oakbrook Dr
- 13828 Oakbrook Dr Unit 3828
- 13826 Oakbrook Dr
- 13824 Oakbrook Dr
- 13974 Oakbrook Dr Unit 3974
- 13972 Oakbrook Dr Unit 3972
- 13976 Oakbrook Dr
- 13978 Oakbrook Dr
- 13976 Oakbrook Dr Unit 3976
- 13968 Oakbrook Dr Unit 3968
- 13966 Oakbrook Dr
- 13964 Oakbrook Dr
- 13962 Oakbrook Dr
- 13872 Oakbrook Dr Unit 3872