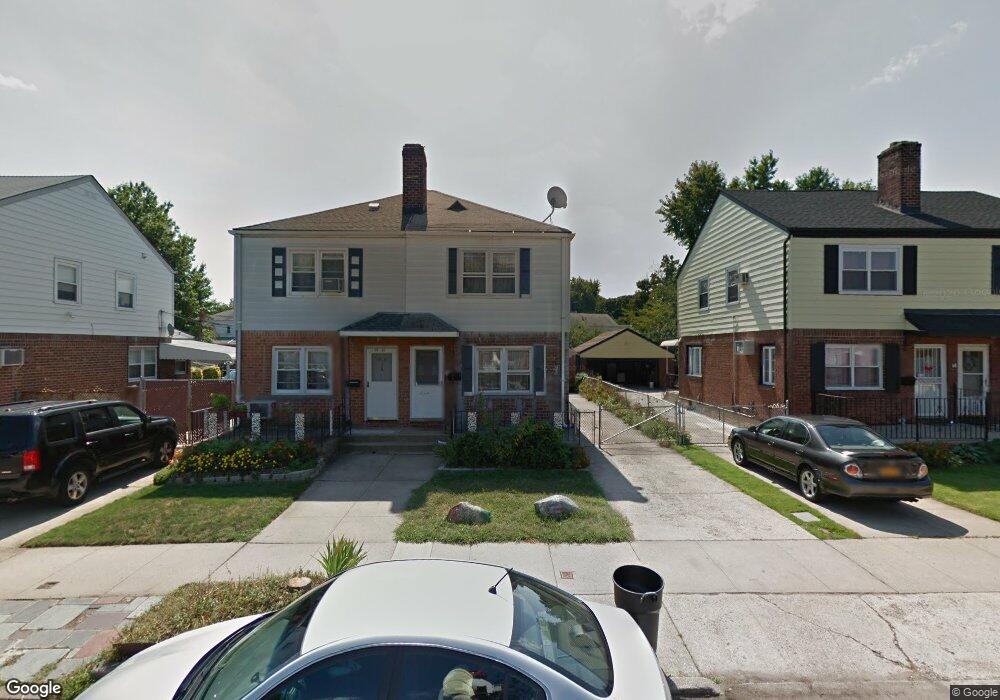
13828 63rd Ave Flushing, NY 11367
Flushing NeighborhoodEstimated Value: $939,028 - $1,256,000
--
Bed
--
Bath
1,318
Sq Ft
$871/Sq Ft
Est. Value
About This Home
This home is located at 13828 63rd Ave, Flushing, NY 11367 and is currently estimated at $1,148,257, approximately $871 per square foot. 13828 63rd Ave is a home located in Queens County with nearby schools including I.S. 250 - The Robert F. Kennedy Community Middle School, John Bowne High School, and Yeshiva Of Central Queens.
Ownership History
Date
Name
Owned For
Owner Type
Purchase Details
Closed on
Oct 30, 2009
Sold by
Gao Xue Nuan and Lin Hui Hua
Bought by
Lin Xiangdan and Wong Grant Teng
Current Estimated Value
Home Financials for this Owner
Home Financials are based on the most recent Mortgage that was taken out on this home.
Original Mortgage
$300,000
Outstanding Balance
$195,688
Interest Rate
4.98%
Mortgage Type
Purchase Money Mortgage
Estimated Equity
$952,569
Purchase Details
Closed on
Jan 12, 2005
Sold by
Maselli Guerino and Maselli Maria
Bought by
Gao Xue Nuan and Lin Hui Hua
Home Financials for this Owner
Home Financials are based on the most recent Mortgage that was taken out on this home.
Original Mortgage
$333,700
Interest Rate
5.67%
Mortgage Type
Purchase Money Mortgage
Create a Home Valuation Report for This Property
The Home Valuation Report is an in-depth analysis detailing your home's value as well as a comparison with similar homes in the area
Home Values in the Area
Average Home Value in this Area
Purchase History
| Date | Buyer | Sale Price | Title Company |
|---|---|---|---|
| Lin Xiangdan | $560,000 | -- | |
| Gao Xue Nuan | $494,388 | -- |
Source: Public Records
Mortgage History
| Date | Status | Borrower | Loan Amount |
|---|---|---|---|
| Open | Lin Xiangdan | $300,000 | |
| Previous Owner | Gao Xue Nuan | $333,700 |
Source: Public Records
Tax History Compared to Growth
Tax History
| Year | Tax Paid | Tax Assessment Tax Assessment Total Assessment is a certain percentage of the fair market value that is determined by local assessors to be the total taxable value of land and additions on the property. | Land | Improvement |
|---|---|---|---|---|
| 2025 | $8,259 | $45,069 | $9,903 | $35,166 |
| 2024 | $8,271 | $42,518 | $10,544 | $31,974 |
| 2023 | $7,775 | $40,112 | $9,296 | $30,816 |
| 2022 | $1,817 | $46,560 | $12,960 | $33,600 |
| 2021 | $7,668 | $44,820 | $12,960 | $31,860 |
| 2020 | $7,654 | $49,260 | $12,960 | $36,300 |
| 2019 | $7,119 | $47,340 | $12,960 | $34,380 |
| 2018 | $6,516 | $33,427 | $8,709 | $24,718 |
| 2017 | $6,129 | $31,536 | $8,846 | $22,690 |
| 2016 | $5,994 | $31,536 | $8,846 | $22,690 |
| 2015 | $3,368 | $31,298 | $12,753 | $18,545 |
| 2014 | $3,368 | $29,527 | $12,908 | $16,619 |
Source: Public Records
Map
Nearby Homes
- 63-05 138th St
- 138-65 63rd Ave
- 63-09 138th St
- 61-12 Main St
- 136-28 62nd Ave
- 6431 138th St
- 61-31 136th St
- 64-35 138th St
- 6339 136th St
- 13506 62nd Rd
- 148-03 Horace Harding Expy
- 136-43 58th Rd
- 132-56 60th Ave
- 148-40 61st Rd
- 58-04 Main St Unit 1A
- 5804 Main St Unit 2D
- 13403 59th Ave
- 13214 Horace Harding Expy
- 14850 60th Ave
- 132-20 60th Ave
- 13830 63rd Ave
- 13824 63rd Ave
- 138-32 63 Ave
- 138-32 63rd Ave
- 13832 63rd Ave
- 13822 63rd Ave
- 138-20 63rd Ave
- 13834 63rd Ave
- 13820 63rd Ave
- 13818 63rd Ave
- 13838 63rd Ave
- 13818 63rd Ave
- 138-18 63rd Ave
- 138-38 63rd Ave
- 13829 64th Ave
- 13833 64th Ave
- 138-40 63rd Ave
- 13835 64th Ave
- 13840 63rd Ave
- 13814 63rd Ave