Estimated Value: $899,345 - $994,000
4
Beds
3
Baths
2,652
Sq Ft
$363/Sq Ft
Est. Value
About This Home
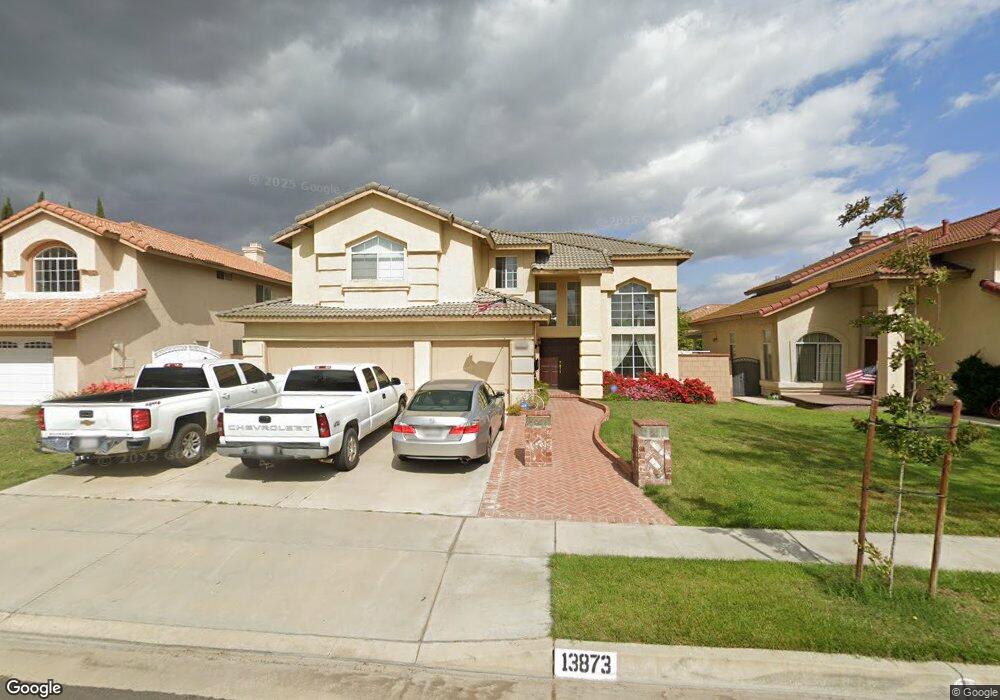
This home is located at 13873 Cottonwood Ave, Chino, CA 91710 and is currently estimated at $962,586, approximately $362 per square foot. 13873 Cottonwood Ave is a home located in San Bernardino County with nearby schools including Edwin Rhodes Elementary, Magnolia Junior High, and Chino High School.
Ownership History
Date
Name
Owned For
Owner Type
Purchase Details
Closed on
Apr 3, 2020
Sold by
Dieffenbacher Paul T and Dieffenbacher Beverly
Bought by
Dieffenbacher Beverly June and Dieffenbacher Paul Thomas
Current Estimated Value
Purchase Details
Closed on
Feb 22, 2008
Sold by
Dieffenbacher Paul T
Bought by
Dieffenbacher Paul T and Dieffenbacher Beverly
Home Financials for this Owner
Home Financials are based on the most recent Mortgage that was taken out on this home.
Original Mortgage
$256,000
Outstanding Balance
$48,186
Interest Rate
5.64%
Mortgage Type
New Conventional
Estimated Equity
$914,400
Purchase Details
Closed on
Mar 19, 1996
Sold by
Classic Development Corp
Bought by
Dieffenbacher Paul T and Dieffenbacher Beverly
Home Financials for this Owner
Home Financials are based on the most recent Mortgage that was taken out on this home.
Original Mortgage
$177,300
Interest Rate
7.34%
Create a Home Valuation Report for This Property
The Home Valuation Report is an in-depth analysis detailing your home's value as well as a comparison with similar homes in the area
Home Values in the Area
Average Home Value in this Area
Purchase History
| Date | Buyer | Sale Price | Title Company |
|---|---|---|---|
| Dieffenbacher Beverly June | -- | None Available | |
| Dieffenbacher Paul T | -- | Ticor Title Company | |
| Dieffenbacher Paul T | $222,000 | Continental Lawyers Title Co |
Source: Public Records
Mortgage History
| Date | Status | Borrower | Loan Amount |
|---|---|---|---|
| Open | Dieffenbacher Paul T | $256,000 | |
| Closed | Dieffenbacher Paul T | $177,300 |
Source: Public Records
Tax History Compared to Growth
Tax History
| Year | Tax Paid | Tax Assessment Tax Assessment Total Assessment is a certain percentage of the fair market value that is determined by local assessors to be the total taxable value of land and additions on the property. | Land | Improvement |
|---|---|---|---|---|
| 2025 | $4,104 | $368,233 | $99,675 | $268,558 |
| 2024 | $4,104 | $361,013 | $97,721 | $263,292 |
| 2023 | $3,994 | $353,934 | $95,805 | $258,129 |
| 2022 | $3,970 | $346,994 | $93,926 | $253,068 |
| 2021 | $3,894 | $340,190 | $92,084 | $248,106 |
| 2020 | $3,846 | $336,702 | $91,140 | $245,562 |
| 2019 | $3,780 | $330,100 | $89,353 | $240,747 |
| 2018 | $3,699 | $323,627 | $87,601 | $236,026 |
| 2017 | $3,635 | $317,281 | $85,883 | $231,398 |
| 2016 | $3,407 | $311,060 | $84,199 | $226,861 |
| 2015 | $3,341 | $306,387 | $82,934 | $223,453 |
| 2014 | $3,277 | $300,385 | $81,309 | $219,076 |
Source: Public Records
Map
Nearby Homes
- 6594 Manzanita Ct
- 13775 Harvard Ave
- 6570 Encina St
- 6952 Silverado St
- 14170 Durazno Ave
- 13846 Farmhouse Ave
- 14134 Mountain Ave
- 14380 Belhaven Ave
- 14349 Guilford Ave
- 6212 Athena St
- 14400 Belhaven Ave
- 11610 Granville Place
- 6169 Winona St
- 13462 Mashona Ave
- 13360 Goldmedal Ave
- 14212 Willamette Ave
- 6501 Wheaton St
- 6162 Davidson St
- 6956 Dublin Dr
- 6550 Eucalyptus Ave
- 13865 Cottonwood Ave
- 13881 Cottonwood Ave
- 13872 Olivewood Ave
- 13864 Olivewood Ave
- 13880 Olivewood Ave
- 13857 Cottonwood Ave
- 13889 Cottonwood Ave
- 6615 Manzanita Ct
- 13856 Olivewood Ave
- 13888 Olivewood Ave
- 6616 Elm St
- 13849 Cottonwood Ave
- 13897 Cottonwood Ave
- 6605 Manzanita Ct
- 13848 Olivewood Ave
- 13904 Olivewood Ave
- 6606 Elm St
- 6614 Manzanita Ct
- 13841 Cottonwood Ave
- 13871 Olivewood Ave