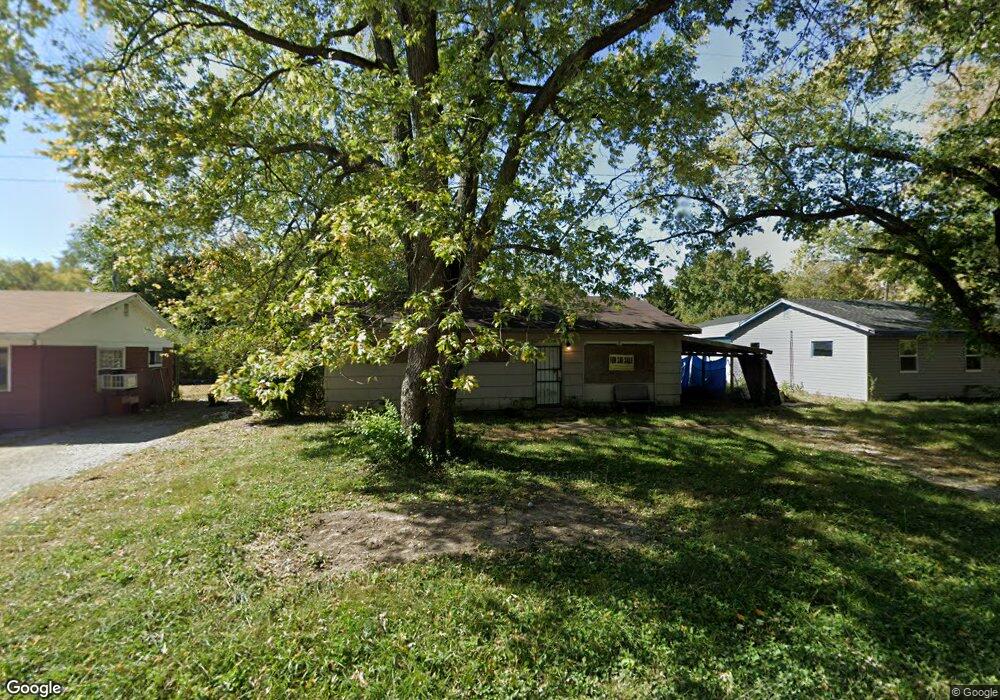
139 Amelia Dr East Saint Louis, IL 62206
Estimated Value: $37,000 - $72,000
--
Bed
--
Bath
900
Sq Ft
$60/Sq Ft
Est. Value
About This Home
This home is located at 139 Amelia Dr, East Saint Louis, IL 62206 and is currently estimated at $54,062, approximately $60 per square foot. 139 Amelia Dr is a home located in St. Clair County.
Ownership History
Date
Name
Owned For
Owner Type
Purchase Details
Closed on
Sep 18, 2013
Sold by
Smith Parke
Bought by
Adams Willie C
Current Estimated Value
Purchase Details
Closed on
Jan 12, 2006
Sold by
Rogers Alfred and Rogers Roberta
Bought by
Smith Parke A
Home Financials for this Owner
Home Financials are based on the most recent Mortgage that was taken out on this home.
Original Mortgage
$32,320
Interest Rate
6.95%
Mortgage Type
Purchase Money Mortgage
Purchase Details
Closed on
Jan 16, 2004
Sold by
Koenig Arthur H and Koening Diana S
Bought by
Rogers Alfred and Rogers Roberta
Create a Home Valuation Report for This Property
The Home Valuation Report is an in-depth analysis detailing your home's value as well as a comparison with similar homes in the area
Home Values in the Area
Average Home Value in this Area
Purchase History
| Date | Buyer | Sale Price | Title Company |
|---|---|---|---|
| Adams Willie C | -- | None Available | |
| Smith Parke A | $30,000 | Benchmark Title Company | |
| Rogers Alfred | $14,000 | Metro East Title Corporation |
Source: Public Records
Mortgage History
| Date | Status | Borrower | Loan Amount |
|---|---|---|---|
| Previous Owner | Smith Parke A | $32,320 |
Source: Public Records
Tax History Compared to Growth
Tax History
| Year | Tax Paid | Tax Assessment Tax Assessment Total Assessment is a certain percentage of the fair market value that is determined by local assessors to be the total taxable value of land and additions on the property. | Land | Improvement |
|---|---|---|---|---|
| 2024 | $747 | $5,010 | $462 | $4,548 |
| 2023 | $671 | $4,529 | $418 | $4,111 |
| 2022 | $575 | $3,969 | $366 | $3,603 |
| 2021 | $597 | $3,761 | $347 | $3,414 |
| 2020 | $615 | $3,698 | $364 | $3,334 |
| 2019 | $638 | $3,698 | $364 | $3,334 |
| 2018 | $645 | $3,752 | $369 | $3,383 |
| 2017 | $760 | $3,661 | $360 | $3,301 |
| 2016 | $905 | $4,843 | $359 | $4,484 |
| 2014 | $739 | $4,790 | $355 | $4,435 |
| 2013 | $753 | $4,493 | $333 | $4,160 |
Source: Public Records
Map
Nearby Homes