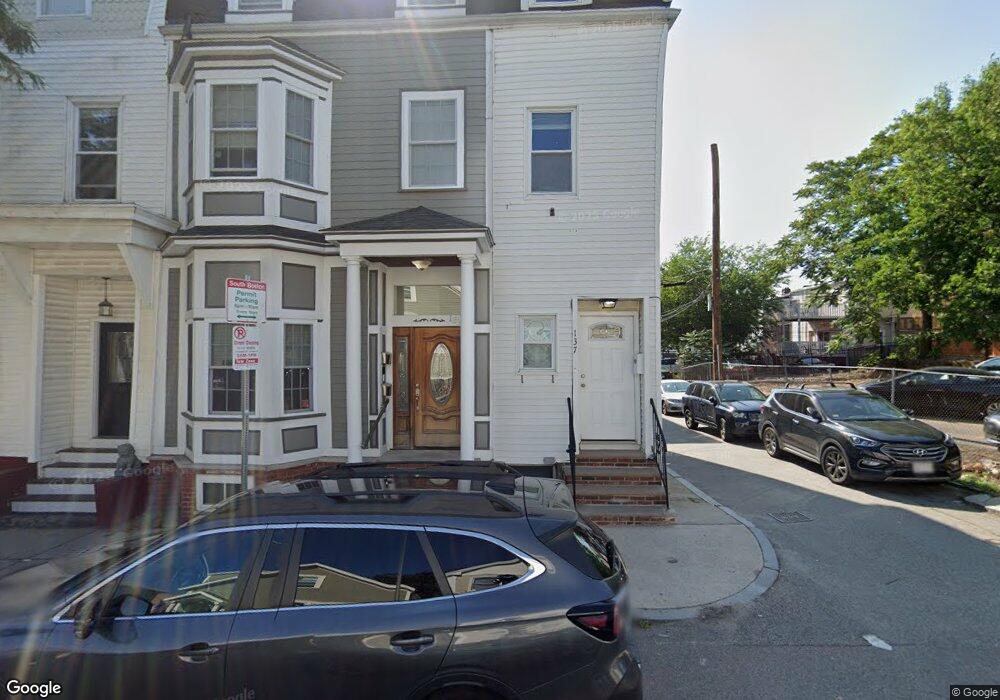
139 O St Unit 1 Boston, MA 02127
South Boston NeighborhoodEstimated Value: $810,000 - $1,044,000
2
Beds
3
Baths
1,106
Sq Ft
$812/Sq Ft
Est. Value
About This Home
This home is located at 139 O St Unit 1, Boston, MA 02127 and is currently estimated at $898,411, approximately $812 per square foot. 139 O St Unit 1 is a home located in Suffolk County with nearby schools including South Boston Catholic Academy, Gate of Heaven Elementary School, and St Peter Academy.
Ownership History
Date
Name
Owned For
Owner Type
Purchase Details
Closed on
Jul 30, 2020
Sold by
Pena Jose and Bulter Shawna M
Bought by
Bulter-Pena Lt and Pena
Current Estimated Value
Purchase Details
Closed on
Oct 15, 2019
Sold by
Butler Shawna M
Bought by
Pena Jose and Butler Shawna M
Home Financials for this Owner
Home Financials are based on the most recent Mortgage that was taken out on this home.
Original Mortgage
$320,000
Interest Rate
3.2%
Mortgage Type
New Conventional
Purchase Details
Closed on
Mar 31, 2008
Sold by
139 O Street Rt and Winick
Bought by
Butler Shawna M
Home Financials for this Owner
Home Financials are based on the most recent Mortgage that was taken out on this home.
Original Mortgage
$410,000
Interest Rate
5.76%
Mortgage Type
Purchase Money Mortgage
Create a Home Valuation Report for This Property
The Home Valuation Report is an in-depth analysis detailing your home's value as well as a comparison with similar homes in the area
Home Values in the Area
Average Home Value in this Area
Purchase History
| Date | Buyer | Sale Price | Title Company |
|---|---|---|---|
| Bulter-Pena Lt | -- | None Available | |
| Pena Jose | -- | -- | |
| Butler Shawna M | $410,000 | -- | |
| Butler Shawna M | $410,000 | -- |
Source: Public Records
Mortgage History
| Date | Status | Borrower | Loan Amount |
|---|---|---|---|
| Previous Owner | Pena Jose | $320,000 | |
| Previous Owner | Butler Shawna M | $410,000 |
Source: Public Records
Tax History Compared to Growth
Tax History
| Year | Tax Paid | Tax Assessment Tax Assessment Total Assessment is a certain percentage of the fair market value that is determined by local assessors to be the total taxable value of land and additions on the property. | Land | Improvement |
|---|---|---|---|---|
| 2025 | $8,798 | $759,800 | $0 | $759,800 |
| 2024 | $7,967 | $730,900 | $0 | $730,900 |
| 2023 | $7,690 | $716,000 | $0 | $716,000 |
| 2022 | $7,490 | $688,400 | $0 | $688,400 |
| 2021 | $7,201 | $674,900 | $0 | $674,900 |
| 2020 | $6,764 | $640,500 | $0 | $640,500 |
| 2019 | $6,311 | $598,800 | $0 | $598,800 |
| 2018 | $5,975 | $570,100 | $0 | $570,100 |
| 2017 | $5,643 | $532,900 | $0 | $532,900 |
| 2016 | $5,530 | $502,700 | $0 | $502,700 |
| 2015 | $5,767 | $476,200 | $0 | $476,200 |
| 2014 | $5,348 | $425,100 | $0 | $425,100 |
Source: Public Records
Map
Nearby Homes
- 803 E 5th St Unit 1
- 786 E 6th St Unit 788
- 761 E 6th St Unit 1
- 722 E 5th St Unit TH
- 823 E 6th St Unit 5
- 901 E Broadway Unit 1
- 907 E 4th St Unit 2
- 33 Lennon Ct Unit 39
- 722 E 6th St
- 915 E 4th St
- 159 N St
- 933 E Broadway
- 788 E 4th St Unit 3
- 713-715 E 7th St Unit 715
- 838 E Broadway Unit 7
- 838 E Broadway Unit 3
- 765 E 3rd St Unit 201
- 733 E 3rd St
- 713 E 7th St Unit 715
- 945 E Broadway Unit 7
- 139 O St
- 139 O St Unit 2
- 137 O St Unit 1
- 137 O St
- 137 O St Unit SF
- 141 O St Unit 3
- 141 O St Unit 2
- 141 O St Unit 1
- 41 Swallow St Unit 3
- 41 Swallow St Unit 2
- 41 Swallow St Unit 1
- 41 Swallow St
- 779 E 5th St Unit 4
- 779 E 5th St Unit 3
- 779 E 5th St Unit 781
- 779 E 5th St Unit 2
- 779 E 5th St Unit 1
- 39 Swallow St Unit 3
- 39 Swallow St Unit 2
- 39 Swallow St Unit 1