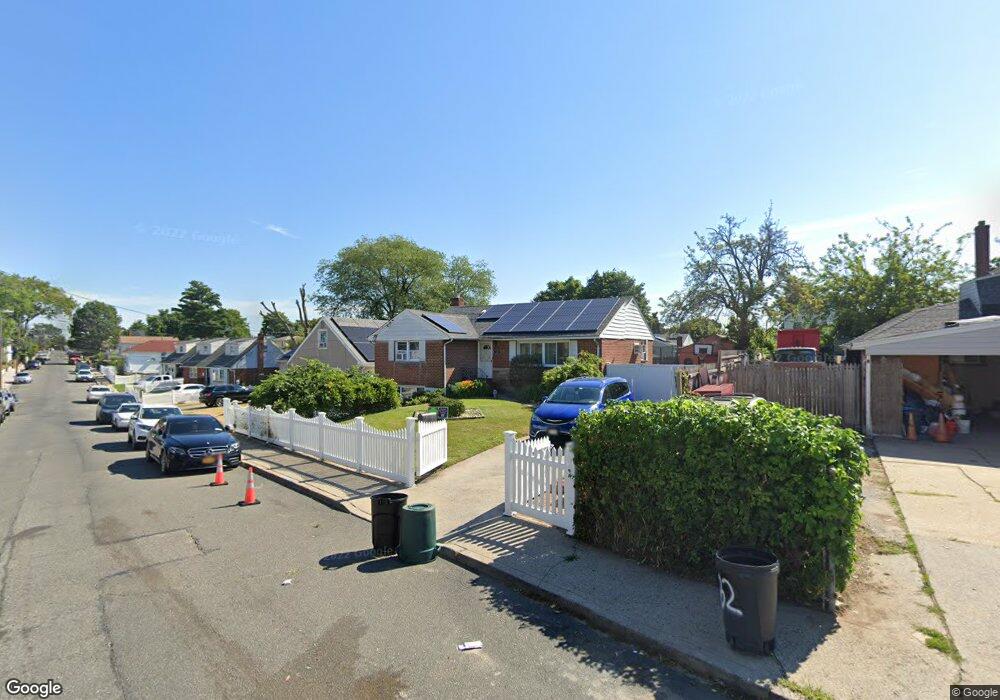
139 Savoy Ave Elmont, NY 11003
Estimated Value: $782,984 - $891,000
--
Bed
2
Baths
1,160
Sq Ft
$722/Sq Ft
Est. Value
About This Home
This home is located at 139 Savoy Ave, Elmont, NY 11003 and is currently estimated at $836,992, approximately $721 per square foot. 139 Savoy Ave is a home located in Nassau County with nearby schools including Martin De Porres School and Bible Baptist Academy.
Ownership History
Date
Name
Owned For
Owner Type
Purchase Details
Closed on
Jun 16, 2025
Sold by
Ricketts Erica and Ricketts Sachelle
Bought by
Ricketts Erica and Ricketts Sachelle
Current Estimated Value
Home Financials for this Owner
Home Financials are based on the most recent Mortgage that was taken out on this home.
Original Mortgage
$601,250
Outstanding Balance
$599,158
Interest Rate
6.74%
Mortgage Type
New Conventional
Estimated Equity
$237,834
Purchase Details
Closed on
Nov 2, 2007
Sold by
Rivarola Ampelio
Bought by
Ricketts Erica
Create a Home Valuation Report for This Property
The Home Valuation Report is an in-depth analysis detailing your home's value as well as a comparison with similar homes in the area
Home Values in the Area
Average Home Value in this Area
Purchase History
| Date | Buyer | Sale Price | Title Company |
|---|---|---|---|
| Ricketts Erica | -- | None Available | |
| Ricketts Erica | $450,000 | -- |
Source: Public Records
Mortgage History
| Date | Status | Borrower | Loan Amount |
|---|---|---|---|
| Open | Ricketts Erica | $601,250 |
Source: Public Records
Tax History Compared to Growth
Tax History
| Year | Tax Paid | Tax Assessment Tax Assessment Total Assessment is a certain percentage of the fair market value that is determined by local assessors to be the total taxable value of land and additions on the property. | Land | Improvement |
|---|---|---|---|---|
| 2025 | $11,674 | $484 | $280 | $204 |
| 2024 | $4,030 | $484 | $280 | $204 |
| 2023 | $10,418 | $484 | $280 | $204 |
| 2022 | $10,418 | $484 | $280 | $204 |
| 2021 | $13,512 | $462 | $267 | $195 |
| 2020 | $9,888 | $640 | $603 | $37 |
| 2019 | $9,455 | $640 | $603 | $37 |
| 2018 | $8,908 | $640 | $0 | $0 |
| 2017 | $4,938 | $640 | $466 | $174 |
| 2016 | $8,077 | $828 | $603 | $225 |
| 2015 | $3,773 | $828 | $603 | $225 |
| 2014 | $3,773 | $828 | $603 | $225 |
| 2013 | $3,538 | $828 | $603 | $225 |
Source: Public Records
Map
Nearby Homes