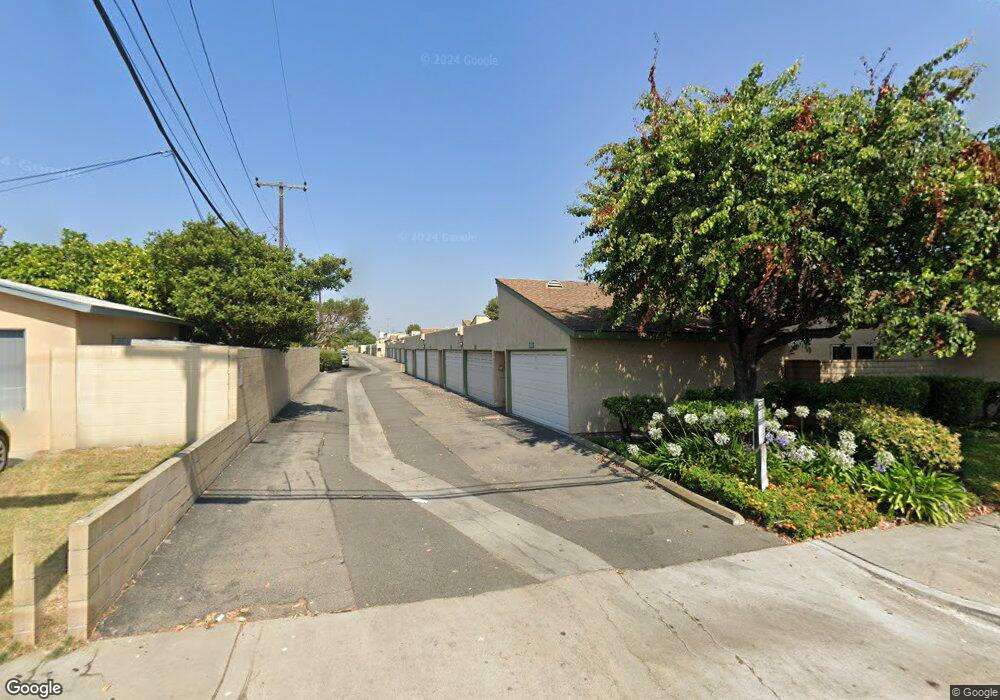
13914 Magnolia St Garden Grove, CA 92844
Estimated Value: $711,132 - $856,000
3
Beds
3
Baths
1,368
Sq Ft
$555/Sq Ft
Est. Value
About This Home
This home is located at 13914 Magnolia St, Garden Grove, CA 92844 and is currently estimated at $758,783, approximately $554 per square foot. 13914 Magnolia St is a home located in Orange County with nearby schools including Cook Elementary School, Donald S. Jordan Intermediate School, and Bolsa Grande High School.
Ownership History
Date
Name
Owned For
Owner Type
Purchase Details
Closed on
Jan 28, 2003
Sold by
Thayer Deborah M and Thayer Richard J
Bought by
Nguyen Thang
Current Estimated Value
Home Financials for this Owner
Home Financials are based on the most recent Mortgage that was taken out on this home.
Original Mortgage
$222,500
Outstanding Balance
$110,131
Interest Rate
8.12%
Estimated Equity
$648,652
Purchase Details
Closed on
Mar 31, 2000
Sold by
Deborah Evans and Deborah Richard J
Bought by
Thayer Richard J and Thayer Deborah M
Home Financials for this Owner
Home Financials are based on the most recent Mortgage that was taken out on this home.
Original Mortgage
$17,074
Interest Rate
8.26%
Mortgage Type
Stand Alone Second
Purchase Details
Closed on
Oct 26, 1994
Sold by
Evans Deborah M
Bought by
Evans Deborah M and Thayer Richard J
Home Financials for this Owner
Home Financials are based on the most recent Mortgage that was taken out on this home.
Original Mortgage
$85,000
Interest Rate
8.7%
Create a Home Valuation Report for This Property
The Home Valuation Report is an in-depth analysis detailing your home's value as well as a comparison with similar homes in the area
Home Values in the Area
Average Home Value in this Area
Purchase History
| Date | Buyer | Sale Price | Title Company |
|---|---|---|---|
| Nguyen Thang | $248,000 | American Title Co | |
| Thayer Richard J | -- | California Counties Title Co | |
| Evans Deborah M | -- | -- |
Source: Public Records
Mortgage History
| Date | Status | Borrower | Loan Amount |
|---|---|---|---|
| Open | Nguyen Thang | $222,500 | |
| Previous Owner | Thayer Richard J | $17,074 | |
| Previous Owner | Evans Deborah M | $85,000 |
Source: Public Records
Tax History Compared to Growth
Tax History
| Year | Tax Paid | Tax Assessment Tax Assessment Total Assessment is a certain percentage of the fair market value that is determined by local assessors to be the total taxable value of land and additions on the property. | Land | Improvement |
|---|---|---|---|---|
| 2025 | $4,566 | $359,177 | $243,546 | $115,631 |
| 2024 | $4,566 | $352,135 | $238,771 | $113,364 |
| 2023 | $4,481 | $345,231 | $234,089 | $111,142 |
| 2022 | $4,385 | $338,462 | $229,499 | $108,963 |
| 2021 | $4,339 | $331,826 | $224,999 | $106,827 |
| 2020 | $4,281 | $328,424 | $222,692 | $105,732 |
| 2019 | $4,201 | $321,985 | $218,326 | $103,659 |
| 2018 | $4,119 | $315,672 | $214,045 | $101,627 |
| 2017 | $4,062 | $309,483 | $209,848 | $99,635 |
| 2016 | $3,865 | $303,415 | $205,733 | $97,682 |
| 2015 | $3,811 | $298,858 | $202,643 | $96,215 |
| 2014 | $3,720 | $293,004 | $198,673 | $94,331 |
Source: Public Records
Map
Nearby Homes
- 13839 Magnolia St
- 9200 Westminster Blvd Unit 25
- 8784 Hewitt Place Unit 12
- 8866 Grandville Cir
- 8741 Jennrich Ave
- 8902 Mcclure Ave
- 13411 Magnolia St
- 13392 Magnolia St
- 13782 Newland St
- 14431 Nola St
- 14642 Birch St
- 8442 Trask Ave
- 14362 Bushard St Unit 39
- 14362 Bushard St Unit 38
- 14362 Bushard St Unit 109
- 14572 Purdy St
- 13252 Newland St Unit A-D
- 8196 18th St
- 8202 19th St
- 14702 Purdy St
- 13912 Magnolia St
- 13916 Magnolia St
- 13910 Magnolia St
- 13918 Magnolia St
- 13920 Magnolia St
- 13922 Magnolia St
- 13948 Magnolia St
- 13950 Magnolia St
- 13952 Magnolia St
- 13954 Magnolia St
- 13946 Magnolia St
- 9012 Ingram Ave
- 9022 Ingram Ave
- 13926 Magnolia St
- 13928 Magnolia St
- 9042 Ingram Ave
- 13930 Magnolia St
- 13942 Magnolia St
- 13940 Magnolia St
- 13938 Magnolia St