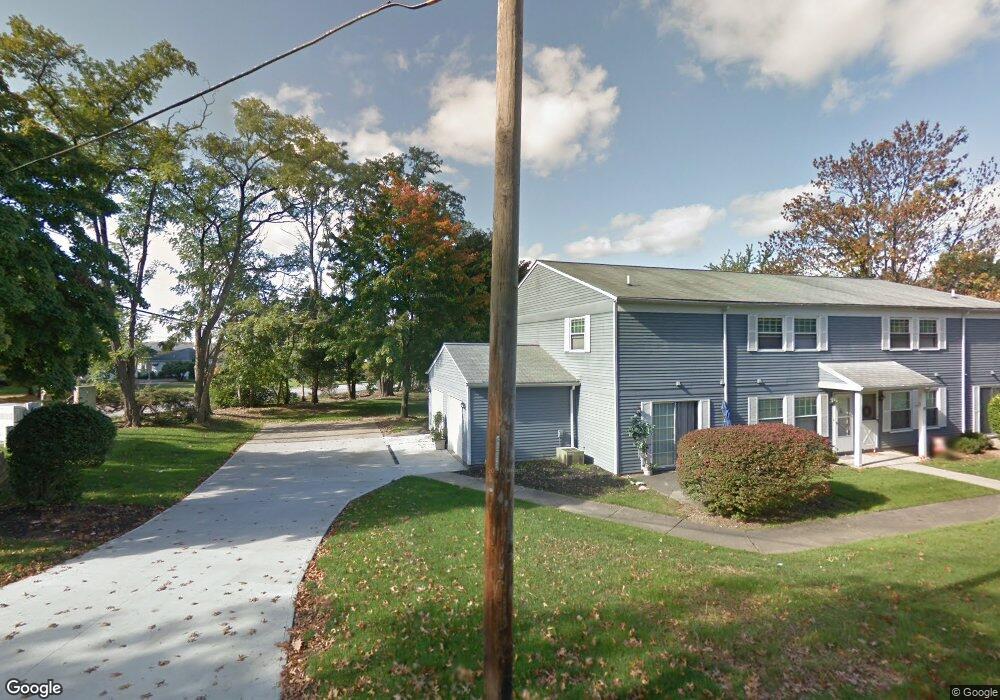
13914 Oakbrook Dr North Royalton, OH 44133
Estimated Value: $161,000 - $190,399
3
Beds
2
Baths
1,148
Sq Ft
$156/Sq Ft
Est. Value
About This Home
This home is located at 13914 Oakbrook Dr, North Royalton, OH 44133 and is currently estimated at $179,350, approximately $156 per square foot. 13914 Oakbrook Dr is a home located in Cuyahoga County with nearby schools including North Royalton Middle School, North Royalton High School, and Royal Redeemer Lutheran School.
Ownership History
Date
Name
Owned For
Owner Type
Purchase Details
Closed on
Oct 27, 2014
Sold by
Hitch David A and Hitch Barbara
Bought by
Mkd Holdings Llc
Current Estimated Value
Home Financials for this Owner
Home Financials are based on the most recent Mortgage that was taken out on this home.
Original Mortgage
$67,000
Outstanding Balance
$53,148
Interest Rate
5%
Mortgage Type
Seller Take Back
Estimated Equity
$126,202
Purchase Details
Closed on
Oct 11, 1991
Sold by
Sickle John E
Bought by
Hitch David A
Purchase Details
Closed on
Jun 23, 1982
Bought by
Sickle John E
Purchase Details
Closed on
Mar 26, 1981
Sold by
Sikorski Eleanor M
Bought by
Addison Rlty Co
Purchase Details
Closed on
Dec 15, 1975
Sold by
Carlson George S
Bought by
Sikorski Eleanor M
Purchase Details
Closed on
Jan 1, 1975
Bought by
Carlson George S
Create a Home Valuation Report for This Property
The Home Valuation Report is an in-depth analysis detailing your home's value as well as a comparison with similar homes in the area
Home Values in the Area
Average Home Value in this Area
Purchase History
| Date | Buyer | Sale Price | Title Company |
|---|---|---|---|
| Mkd Holdings Llc | $75,000 | American Title Solution | |
| Hitch David A | $62,000 | -- | |
| Sickle John E | $50,000 | -- | |
| Addison Rlty Co | $45,000 | -- | |
| Sikorski Eleanor M | $24,000 | -- | |
| Carlson George S | -- | -- |
Source: Public Records
Mortgage History
| Date | Status | Borrower | Loan Amount |
|---|---|---|---|
| Open | Mkd Holdings Llc | $67,000 |
Source: Public Records
Tax History Compared to Growth
Tax History
| Year | Tax Paid | Tax Assessment Tax Assessment Total Assessment is a certain percentage of the fair market value that is determined by local assessors to be the total taxable value of land and additions on the property. | Land | Improvement |
|---|---|---|---|---|
| 2024 | $3,259 | $56,105 | $4,725 | $51,380 |
| 2023 | $2,140 | $33,080 | $3,330 | $29,750 |
| 2022 | $2,126 | $33,080 | $3,330 | $29,750 |
| 2021 | $2,150 | $33,080 | $3,330 | $29,750 |
| 2020 | $1,714 | $25,060 | $2,520 | $22,540 |
| 2019 | $1,665 | $71,600 | $7,200 | $64,400 |
| 2018 | $1,510 | $25,060 | $2,520 | $22,540 |
| 2017 | $1,423 | $20,230 | $2,030 | $18,200 |
| 2016 | $1,336 | $20,230 | $2,030 | $18,200 |
| 2015 | $1,642 | $20,230 | $2,030 | $18,200 |
| 2014 | $1,642 | $25,310 | $2,520 | $22,790 |
Source: Public Records
Map
Nearby Homes
- 13831 Woodcroft Trace
- 8381 N Akins Rd Unit H7
- 12906 Cartwright Pkwy
- 13000 Cartwright Pkwy
- S/L Margaret Dr
- 7554 Margaret Dr
- 7595 Margaret Dr
- 7545 Margaret Dr
- 7585 Margaret Dr
- 7575 Margaret Dr
- 7535 Margaret Dr
- 7555 Margaret Dr
- 7600 Margaret Dr
- 7564 Margaret Dr
- 7574 Margaret Dr
- 12701 Gordon St
- 7332 Creekwood Dr Unit 4B
- 7400 Akins Rd
- 9035 Wallings Rd
- 9447 Lindberg Dr
- 13918 Oakbrook Dr Unit 3918
- 13916 Oakbrook Dr Unit 3916
- 13912 Oakbrook Dr Unit 3912
- 13914 Oakbrook Dr Unit 3914
- 13922 Oakbrook Dr Unit 3922
- 13924 Oakbrook Dr Unit 3924
- 13926 Oakbrook Dr Unit 3926
- 13928 Oakbrook Dr
- 13974 Oakbrook Dr Unit 3974
- 13972 Oakbrook Dr Unit 3972
- 13976 Oakbrook Dr
- 13978 Oakbrook Dr
- 13976 Oakbrook Dr Unit 3976
- 13911 Oakbrook Dr
- 13911 Oakbrook Dr
- 13938 Oakbrook Dr Unit 3938
- 13936 Oakbrook Dr Unit 3936
- 13934 Oakbrook Dr Unit 3934
- 13932 Oakbrook Dr
- 13938 Oakbrook Dr Unit 8