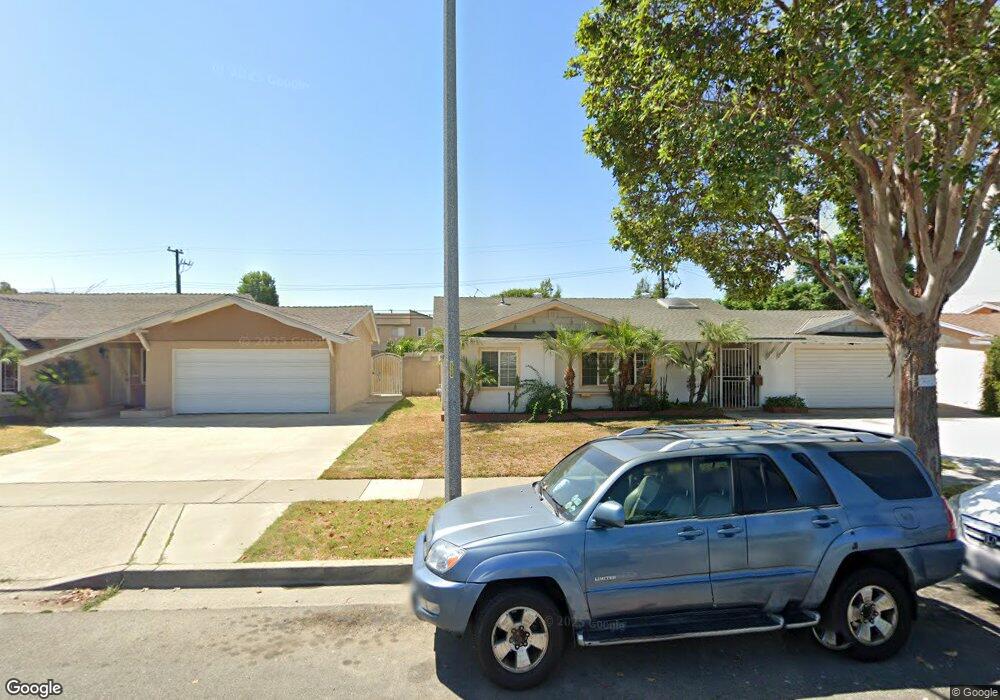
13930 Magnolia St Garden Grove, CA 92844
Estimated Value: $647,788 - $762,000
2
Beds
3
Baths
1,132
Sq Ft
$616/Sq Ft
Est. Value
About This Home
This home is located at 13930 Magnolia St, Garden Grove, CA 92844 and is currently estimated at $696,947, approximately $615 per square foot. 13930 Magnolia St is a home located in Orange County with nearby schools including Cook Elementary School, Donald S. Jordan Intermediate School, and Bolsa Grande High School.
Ownership History
Date
Name
Owned For
Owner Type
Purchase Details
Closed on
Aug 3, 2023
Sold by
Nguyen Hang L and Nguyen Van Q
Bought by
Quyen Vu & Hang Nguyen Family Trust and Vu
Current Estimated Value
Purchase Details
Closed on
May 28, 2003
Sold by
Vu Them Duy and Nguyen Thoi Thi
Bought by
Vanvanvu Quyen Van and Nguyen Hang L
Purchase Details
Closed on
Dec 27, 1999
Sold by
Jaime Vargas and Jaime Juanita Cabrera
Bought by
Vu Them Duy and Nguyen Thoi Thi
Home Financials for this Owner
Home Financials are based on the most recent Mortgage that was taken out on this home.
Original Mortgage
$116,000
Interest Rate
7.84%
Purchase Details
Closed on
Dec 15, 1998
Sold by
Juanita Cabrera and Vargas Judith Vargas
Bought by
Vargas Jaime and Cabrera Juanita
Create a Home Valuation Report for This Property
The Home Valuation Report is an in-depth analysis detailing your home's value as well as a comparison with similar homes in the area
Home Values in the Area
Average Home Value in this Area
Purchase History
| Date | Buyer | Sale Price | Title Company |
|---|---|---|---|
| Quyen Vu & Hang Nguyen Family Trust | -- | None Listed On Document | |
| Vanvanvu Quyen Van | $240,000 | Old Republic Title Company | |
| Vu Them Duy | $141,000 | American Title Co | |
| Vargas Jaime | -- | -- |
Source: Public Records
Mortgage History
| Date | Status | Borrower | Loan Amount |
|---|---|---|---|
| Previous Owner | Vu Them Duy | $116,000 |
Source: Public Records
Tax History Compared to Growth
Tax History
| Year | Tax Paid | Tax Assessment Tax Assessment Total Assessment is a certain percentage of the fair market value that is determined by local assessors to be the total taxable value of land and additions on the property. | Land | Improvement |
|---|---|---|---|---|
| 2025 | $4,277 | $341,218 | $243,665 | $97,553 |
| 2024 | $4,277 | $334,528 | $238,887 | $95,641 |
| 2023 | $4,195 | $327,969 | $234,203 | $93,766 |
| 2022 | $4,103 | $321,539 | $229,611 | $91,928 |
| 2021 | $4,058 | $315,235 | $225,109 | $90,126 |
| 2020 | $4,004 | $312,003 | $222,801 | $89,202 |
| 2019 | $3,928 | $305,886 | $218,433 | $87,453 |
| 2018 | $3,849 | $299,889 | $214,150 | $85,739 |
| 2017 | $3,795 | $294,009 | $209,951 | $84,058 |
| 2016 | $3,610 | $288,245 | $205,835 | $82,410 |
| 2015 | $3,559 | $283,916 | $202,743 | $81,173 |
| 2014 | $3,399 | $272,000 | $197,725 | $74,275 |
Source: Public Records
Map
Nearby Homes
- 9200 Westminster Blvd Unit 25
- 13839 Magnolia St
- 8866 Grandville Cir
- 8784 Hewitt Place Unit 12
- 8902 Mcclure Ave
- 8741 Jennrich Ave
- 13411 Magnolia St
- 14431 Nola St
- 13392 Magnolia St
- 13782 Newland St
- 14362 Bushard St Unit 39
- 14362 Bushard St Unit 38
- 14362 Bushard St Unit 109
- 14642 Birch St
- 14572 Purdy St
- 8442 Trask Ave
- 14702 Purdy St
- 13252 Newland St Unit A-D
- 8196 18th St
- 8202 19th St
- 13928 Magnolia St
- 9167 Westminster Ave
- 13926 Magnolia St
- 9165 Westminster Ave
- 13922 Magnolia St
- 9163 Westminster Ave
- 9161 Westminster Ave
- 13920 Magnolia St
- 9159 Westminster Ave
- 9052 Ingram Ave
- 13918 Magnolia St
- 13936 Magnolia St
- 13932 Magnolia St
- 9157 Westminster Ave
- 13938 Magnolia St
- 13934 Magnolia St
- 9042 Ingram Ave
- 13940 Magnolia St
- 9169 Westminster Ave
- 13942 Magnolia St