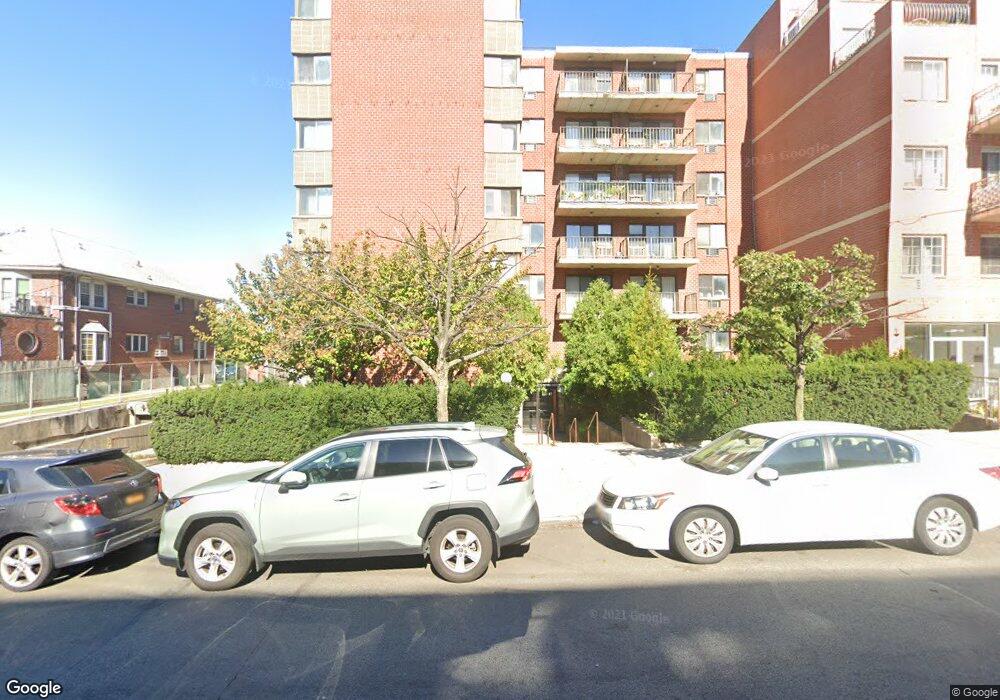
13935 35th Ave Unit 6A Flushing, NY 11354
Flushing NeighborhoodEstimated Value: $382,000 - $471,000
--
Bed
--
Bath
639
Sq Ft
$680/Sq Ft
Est. Value
About This Home
This home is located at 13935 35th Ave Unit 6A, Flushing, NY 11354 and is currently estimated at $434,696, approximately $680 per square foot. 13935 35th Ave Unit 6A is a home located in Queens County with nearby schools including P.S. 21 Edward Hart, Flushing High School, and Windsor School.
Ownership History
Date
Name
Owned For
Owner Type
Purchase Details
Closed on
Mar 28, 2024
Sold by
Chin-Bow Family Trust and James Chin-Bow As Trustee
Bought by
Liu Enxin
Current Estimated Value
Home Financials for this Owner
Home Financials are based on the most recent Mortgage that was taken out on this home.
Original Mortgage
$230,000
Outstanding Balance
$226,151
Interest Rate
6.9%
Mortgage Type
Purchase Money Mortgage
Estimated Equity
$208,545
Purchase Details
Closed on
Jun 7, 2012
Sold by
Chin-Bow Trust and Chin-Bow
Bought by
Chin-Bow Family Trust and Chin-Bow Trust
Purchase Details
Closed on
Dec 18, 2009
Sold by
Chin-Bow Diana
Bought by
Chin-Bow Trust and Chin-Bow
Purchase Details
Closed on
Nov 2, 1995
Sold by
Chin Bow James and Chin Bow Diana
Bought by
Chin Bow Diana
Create a Home Valuation Report for This Property
The Home Valuation Report is an in-depth analysis detailing your home's value as well as a comparison with similar homes in the area
Home Values in the Area
Average Home Value in this Area
Purchase History
| Date | Buyer | Sale Price | Title Company |
|---|---|---|---|
| Liu Enxin | $430,000 | -- | |
| Liu Enxin | $430,000 | -- | |
| Liu Enxin | $430,000 | -- | |
| Chin-Bow Family Trust | -- | -- | |
| Chin-Bow Family Trust | -- | -- | |
| Chin-Bow Trust | -- | -- | |
| Chin-Bow Trust | -- | -- | |
| Chin Bow Diana | -- | First American Title Ins Co | |
| Chin Bow Diana | -- | First American Title Ins Co |
Source: Public Records
Mortgage History
| Date | Status | Borrower | Loan Amount |
|---|---|---|---|
| Open | Liu Enxin | $230,000 | |
| Closed | Liu Enxin | $230,000 |
Source: Public Records
Tax History Compared to Growth
Tax History
| Year | Tax Paid | Tax Assessment Tax Assessment Total Assessment is a certain percentage of the fair market value that is determined by local assessors to be the total taxable value of land and additions on the property. | Land | Improvement |
|---|---|---|---|---|
| 2025 | $4,399 | $34,874 | $4,658 | $30,216 |
| 2024 | $3,163 | $35,187 | $4,658 | $30,529 |
| 2023 | $4,226 | $33,806 | $4,658 | $29,148 |
| 2022 | $2,831 | $35,971 | $4,658 | $31,313 |
| 2021 | $2,637 | $29,895 | $4,658 | $25,237 |
| 2020 | $2,697 | $34,801 | $4,658 | $30,143 |
| 2019 | $2,580 | $31,199 | $4,658 | $26,541 |
| 2018 | $3,402 | $26,744 | $4,589 | $22,155 |
| 2017 | $3,208 | $25,224 | $4,520 | $20,704 |
| 2016 | $3,077 | $25,224 | $4,520 | $20,704 |
| 2015 | -- | $22,374 | $4,385 | $17,989 |
| 2014 | -- | $20,971 | $4,317 | $16,654 |
Source: Public Records
Map
Nearby Homes
- 138-35 39th Ave Unit 10F
- 138-35 39th Ave Unit 17H
- 138-35 39th Ave Unit 4K
- 138-35 39th Ave Unit 12L
- 138-35 39th Ave Unit 11L
- 138-35 39th Ave Unit 8G
- 3205 Linden Place #P7
- 138-35 39th Ave Unit 16K
- 118-09 29th Ave
- 139-35 35th Ave Unit 6F
- 139-39 35th Ave Unit 5C
- 140-39 34th Ave Unit 2T
- 140-40 34th Ave Unit 2A
- 140-33 34th Ave Unit 2B
- 140-33 34th Ave Unit 5C
- 139-30 34th Ave Unit 3B
- 139-30 34th Ave Unit 4C
- 13930 34th Ave Unit 2A
- 140-55 34th Ave Unit 3B
- 140-55 34th Ave Unit 6
- 139-35 35th Ave Unit 1A
- 139-35 35th Ave Unit 4C
- 139-35 35th Ave Unit 2A
- 13935 35th Ave Unit 4C
- 13935 35th Ave Unit 5D
- 13935 35th Ave Unit 6F
- 13935 35th Ave Unit 6E
- 13935 35th Ave Unit 6D
- 13935 35th Ave Unit 6C
- 13935 35th Ave Unit 6B
- 13935 35th Ave Unit 5F
- 13935 35th Ave Unit 5E
- 13935 35th Ave Unit 5C
- 13935 35th Ave Unit 5B
- 13935 35th Ave Unit 5A
- 13935 35th Ave Unit 4F
- 13935 35th Ave Unit 4E
- 13935 35th Ave Unit 4D
- 13935 35th Ave Unit 4C
- 13935 35th Ave Unit 4B