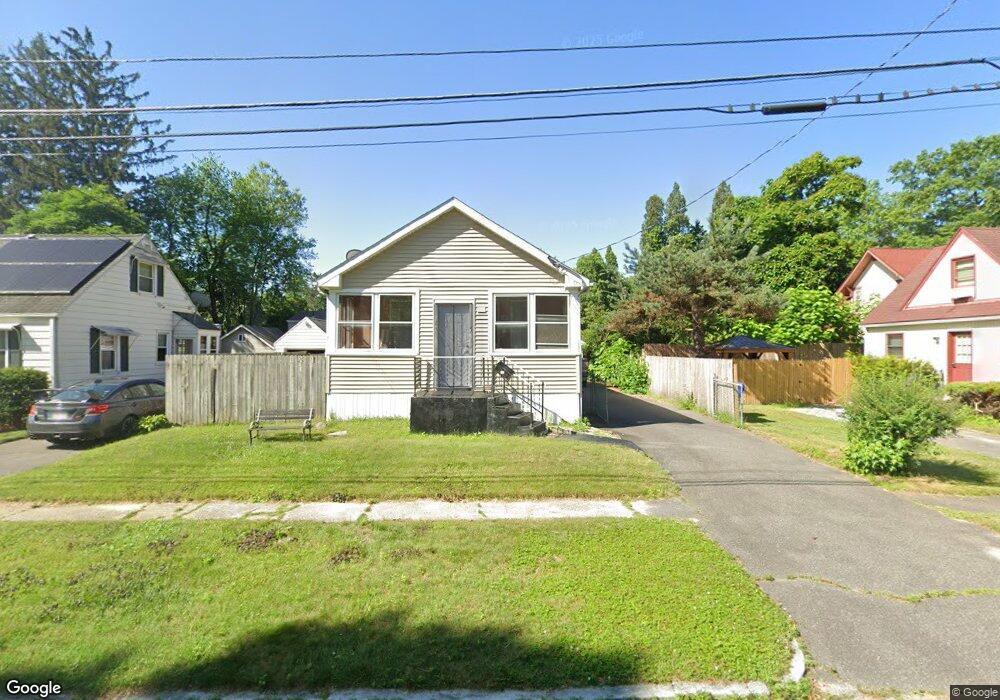
14 Michigan St Indian Orchard, MA 01151
Indian Orchard NeighborhoodEstimated Value: $214,851 - $326,000
2
Beds
1
Bath
760
Sq Ft
$325/Sq Ft
Est. Value
About This Home
This home is located at 14 Michigan St, Indian Orchard, MA 01151 and is currently estimated at $247,213, approximately $325 per square foot. 14 Michigan St is a home located in Hampden County with nearby schools including Hiram L. Dorman Elementary, John F. Kennedy Academy, and Springfield Central High School.
Ownership History
Date
Name
Owned For
Owner Type
Purchase Details
Closed on
Jan 9, 2008
Sold by
Harrington George
Bought by
Onofrey John E and Onofrey Tina M
Current Estimated Value
Home Financials for this Owner
Home Financials are based on the most recent Mortgage that was taken out on this home.
Original Mortgage
$113,490
Interest Rate
6.21%
Mortgage Type
Purchase Money Mortgage
Purchase Details
Closed on
Sep 13, 1996
Sold by
Department Of Housing & Urban Dev
Bought by
Harrington George
Purchase Details
Closed on
Jul 11, 1995
Sold by
Lussier Kenneth J and Keever Mary J
Bought by
Department Of Housing & Urban Dev
Purchase Details
Closed on
Oct 13, 1989
Sold by
Keever Mary J
Bought by
Lussier Kenneth J
Purchase Details
Closed on
Sep 30, 1988
Sold by
Cherry Ronald J
Bought by
Lussier Kenneth J
Create a Home Valuation Report for This Property
The Home Valuation Report is an in-depth analysis detailing your home's value as well as a comparison with similar homes in the area
Home Values in the Area
Average Home Value in this Area
Purchase History
| Date | Buyer | Sale Price | Title Company |
|---|---|---|---|
| Onofrey John E | $117,000 | -- | |
| Harrington George | $33,000 | -- | |
| Department Of Housing & Urban Dev | $55,000 | -- | |
| Lussier Kenneth J | $2,000 | -- | |
| Lussier Kenneth J | $88,000 | -- |
Source: Public Records
Mortgage History
| Date | Status | Borrower | Loan Amount |
|---|---|---|---|
| Open | Lussier Kenneth J | $118,241 | |
| Closed | Onofrey John E | $113,490 | |
| Previous Owner | Lussier Kenneth J | $51,000 | |
| Previous Owner | Lussier Kenneth J | $12,630 |
Source: Public Records
Tax History Compared to Growth
Tax History
| Year | Tax Paid | Tax Assessment Tax Assessment Total Assessment is a certain percentage of the fair market value that is determined by local assessors to be the total taxable value of land and additions on the property. | Land | Improvement |
|---|---|---|---|---|
| 2025 | $2,982 | $190,200 | $43,000 | $147,200 |
| 2024 | $2,531 | $157,600 | $40,200 | $117,400 |
| 2023 | $2,274 | $133,400 | $32,900 | $100,500 |
| 2022 | $2,460 | $130,700 | $30,800 | $99,900 |
| 2021 | $2,196 | $116,200 | $28,000 | $88,200 |
| 2020 | $1,828 | $93,600 | $28,000 | $65,600 |
| 2019 | $1,842 | $93,600 | $29,000 | $64,600 |
| 2018 | $1,696 | $86,200 | $29,000 | $57,200 |
| 2017 | $1,596 | $81,200 | $24,700 | $56,500 |
| 2016 | $1,575 | $80,100 | $24,700 | $55,400 |
| 2015 | $1,597 | $81,200 | $24,700 | $56,500 |
Source: Public Records
Map
Nearby Homes
- 37 Champlain Ave
- 42 Geneva St
- 49 Mohegan Ave
- 108 Barre St
- 140 Cardinal St
- 98 Pine Grove St
- 34 Wallace St
- 39 Wallace St
- 97-99 Pine Grove St
- 89 Pine Grove St
- 0 Michon St
- 320 Tremont St
- 34 Temby St
- 70 Shumway St Unit 29
- 70 Shumway St Unit A1
- 19 Emily St
- 543 Boston Rd
- 523 Boston Rd
- 31 Wing St
- 32 Better Way
- 18 Michigan St
- 6 Michigan St
- 993 Berkshire Ave
- 24 Michigan St
- 11 Homestead Ave
- 17 Homestead Ave
- 17 Homestead Ave Unit 1
- 985 Berkshire Ave
- 28 Michigan St
- 1007 Berkshire Ave
- 17 Michigan St
- 21 Michigan St
- 1009 Berkshire Ave
- 1013 Berkshire Ave
- 33 Homestead Ave
- 38 Michigan St
- 14 Superior Ave
- 18 Superior Ave
- 33 Michigan St
- 998 Berkshire Ave