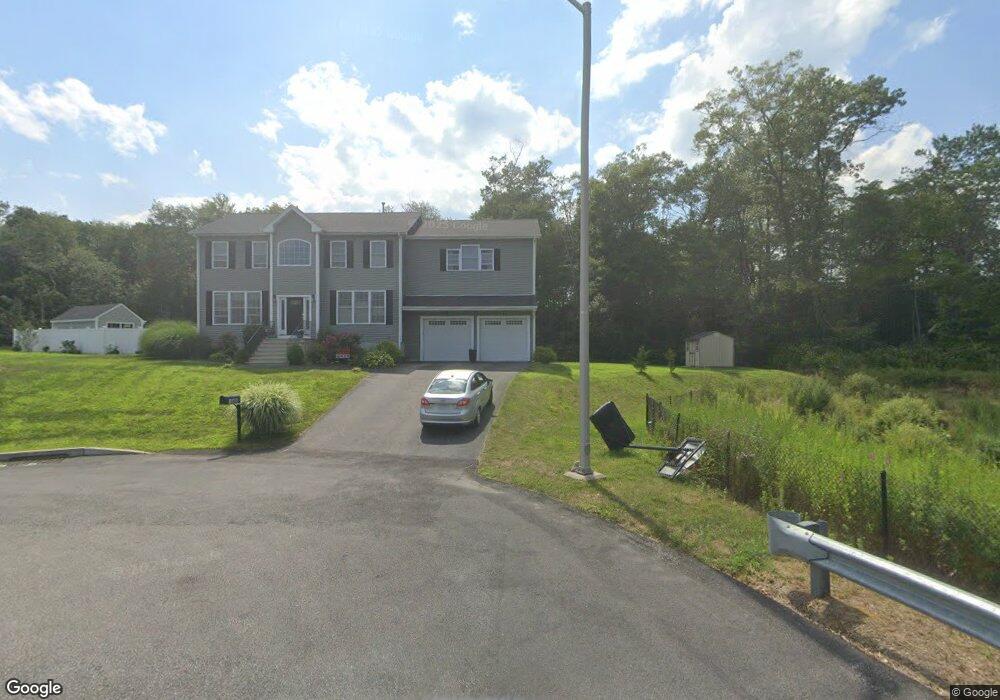
140 Kayleigh Ct Swansea, MA 02777
West Swansea NeighborhoodEstimated Value: $757,057 - $844,000
4
Beds
3
Baths
2,387
Sq Ft
$341/Sq Ft
Est. Value
About This Home
This home is located at 140 Kayleigh Ct, Swansea, MA 02777 and is currently estimated at $814,514, approximately $341 per square foot. 140 Kayleigh Ct is a home with nearby schools including Joseph Case High School and Swansea Wood School.
Ownership History
Date
Name
Owned For
Owner Type
Purchase Details
Closed on
Apr 21, 2017
Sold by
Costa Development Llc
Bought by
Davis Donald F and Pinales-Davis Maria
Current Estimated Value
Home Financials for this Owner
Home Financials are based on the most recent Mortgage that was taken out on this home.
Original Mortgage
$438,912
Outstanding Balance
$365,241
Interest Rate
4.21%
Mortgage Type
New Conventional
Estimated Equity
$449,273
Create a Home Valuation Report for This Property
The Home Valuation Report is an in-depth analysis detailing your home's value as well as a comparison with similar homes in the area
Home Values in the Area
Average Home Value in this Area
Purchase History
| Date | Buyer | Sale Price | Title Company |
|---|---|---|---|
| Davis Donald F | $453,230 | -- |
Source: Public Records
Mortgage History
| Date | Status | Borrower | Loan Amount |
|---|---|---|---|
| Open | Davis Donald F | $438,912 |
Source: Public Records
Tax History Compared to Growth
Tax History
| Year | Tax Paid | Tax Assessment Tax Assessment Total Assessment is a certain percentage of the fair market value that is determined by local assessors to be the total taxable value of land and additions on the property. | Land | Improvement |
|---|---|---|---|---|
| 2025 | $8,296 | $696,000 | $239,000 | $457,000 |
| 2024 | $8,345 | $696,000 | $239,000 | $457,000 |
| 2023 | $7,510 | $572,000 | $182,000 | $390,000 |
| 2022 | $6,651 | $462,200 | $142,800 | $319,400 |
| 2021 | $6,774 | $433,400 | $151,000 | $282,400 |
| 2020 | $6,843 | $439,200 | $151,000 | $288,200 |
| 2019 | $6,840 | $441,000 | $135,700 | $305,300 |
| 2018 | $6,780 | $443,700 | $141,800 | $301,900 |
| 2017 | $1,085 | $81,700 | $81,700 | $0 |
| 2016 | $416 | $30,800 | $30,800 | $0 |
| 2015 | $404 | $30,800 | $30,800 | $0 |
| 2014 | $395 | $30,800 | $30,800 | $0 |
Source: Public Records
Map
Nearby Homes