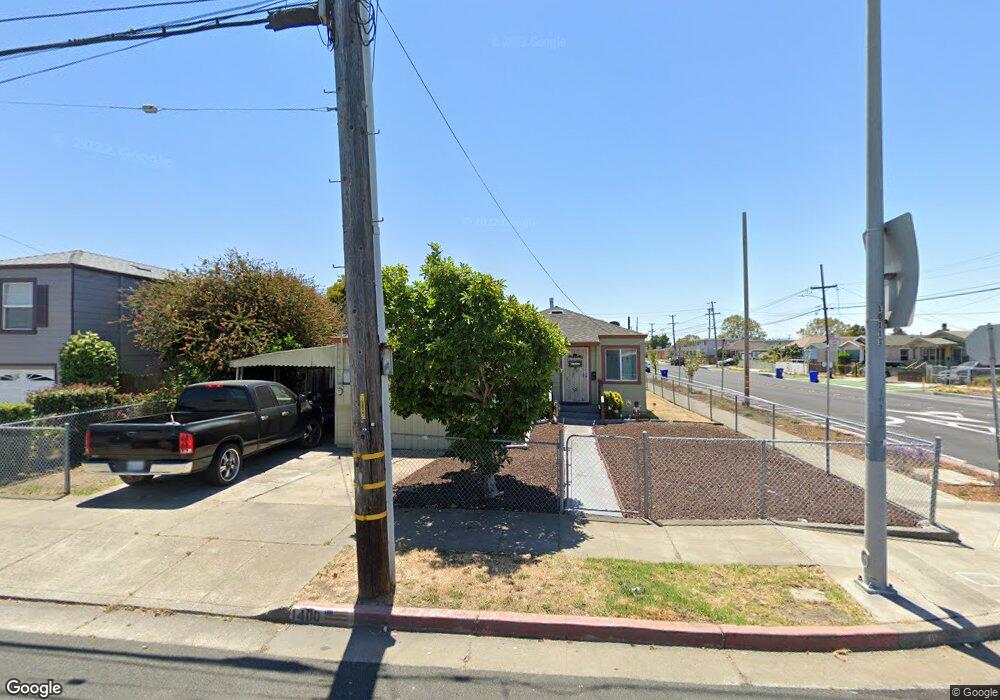
1400 Ohio Ave Richmond, CA 94804
Coronado NeighborhoodEstimated Value: $486,583 - $548,000
2
Beds
1
Bath
1,159
Sq Ft
$452/Sq Ft
Est. Value
About This Home
This home is located at 1400 Ohio Ave, Richmond, CA 94804 and is currently estimated at $523,896, approximately $452 per square foot. 1400 Ohio Ave is a home located in Contra Costa County with nearby schools including Nystrom Elementary School, Lovonya DeJean Middle School, and John F. Kennedy High School.
Ownership History
Date
Name
Owned For
Owner Type
Purchase Details
Closed on
Apr 8, 2008
Sold by
Walls Stewart Dorothy
Bought by
Stewart John R and Walls Stewart Dorothy
Current Estimated Value
Purchase Details
Closed on
Apr 12, 2007
Sold by
Walls Bertha L and Walls Stewart Dorothy
Bought by
Walls Stewart Dorothy and Walls Bertha L
Home Financials for this Owner
Home Financials are based on the most recent Mortgage that was taken out on this home.
Original Mortgage
$55,000
Outstanding Balance
$40,846
Interest Rate
10.84%
Mortgage Type
Stand Alone Refi Refinance Of Original Loan
Estimated Equity
$483,050
Purchase Details
Closed on
Feb 24, 2007
Sold by
Walls Bertha L
Bought by
Walls Bertha L and Walls Stewart Dorothy
Home Financials for this Owner
Home Financials are based on the most recent Mortgage that was taken out on this home.
Original Mortgage
$55,000
Outstanding Balance
$40,846
Interest Rate
10.84%
Mortgage Type
Stand Alone Refi Refinance Of Original Loan
Estimated Equity
$483,050
Create a Home Valuation Report for This Property
The Home Valuation Report is an in-depth analysis detailing your home's value as well as a comparison with similar homes in the area
Home Values in the Area
Average Home Value in this Area
Purchase History
| Date | Buyer | Sale Price | Title Company |
|---|---|---|---|
| Stewart John R | -- | Commerce Title Company | |
| Walls Stewart Dorothy | -- | First American Title Co | |
| Walls Stewart Dorothy | -- | First American Title Co | |
| Walls Bertha L | -- | None Available |
Source: Public Records
Mortgage History
| Date | Status | Borrower | Loan Amount |
|---|---|---|---|
| Open | Walls Stewart Dorothy | $55,000 |
Source: Public Records
Tax History Compared to Growth
Tax History
| Year | Tax Paid | Tax Assessment Tax Assessment Total Assessment is a certain percentage of the fair market value that is determined by local assessors to be the total taxable value of land and additions on the property. | Land | Improvement |
|---|---|---|---|---|
| 2025 | $5,154 | $262,691 | $65,669 | $197,022 |
| 2024 | $5,085 | $257,541 | $64,382 | $193,159 |
| 2023 | $5,085 | $252,492 | $63,120 | $189,372 |
| 2022 | $4,972 | $247,542 | $61,883 | $185,659 |
| 2021 | $4,899 | $242,689 | $60,670 | $182,019 |
| 2019 | $4,598 | $235,492 | $58,871 | $176,621 |
| 2018 | $4,432 | $230,875 | $57,717 | $173,158 |
| 2017 | $4,322 | $226,349 | $56,586 | $169,763 |
| 2016 | $4,247 | $221,912 | $55,477 | $166,435 |
| 2015 | $4,210 | $218,579 | $54,644 | $163,935 |
| 2014 | $3,664 | $166,000 | $41,500 | $124,500 |
Source: Public Records
Map
Nearby Homes
- 1532 Chanslor Ave
- 1532 Chanslor Ave Unit T
- 1532 Chanslor Ave
- 1317 Chanslor Ave
- 130 Maine Ave
- 138 S 17th St
- 146 S 17th St
- 43 11th St
- 0 Harbour Way Unit 41108932
- 350 Marina Way S
- 330 S 16th St
- 1401 Bissell Ave
- 338 S 16th St
- 227 15th St
- 228 15th St
- 146 19th St
- 447 S 16th St
- 1817 Virginia Ave
- 2107 Ohio Ave
- 241 Espee Ave
- 1410 Ohio Ave
- 118 Marina Way S
- 1416 Ohio Ave
- 1420 Ohio Ave
- 126 Marina Way S
- 105 Marina Way S
- 119 S 15th St
- 101 S 15th St
- 109 S 15th St
- 134 Marina Way S
- 125 S 15th St
- 1413 Ohio Ave
- 119 Marina Way S
- 1320 Ohio Ave
- 121 Marina Way S
- 127 Marina Way S
- 140 Marina Way S
- 135 Marina Way S
- 139 S 15th St
- 144 Marina Way S