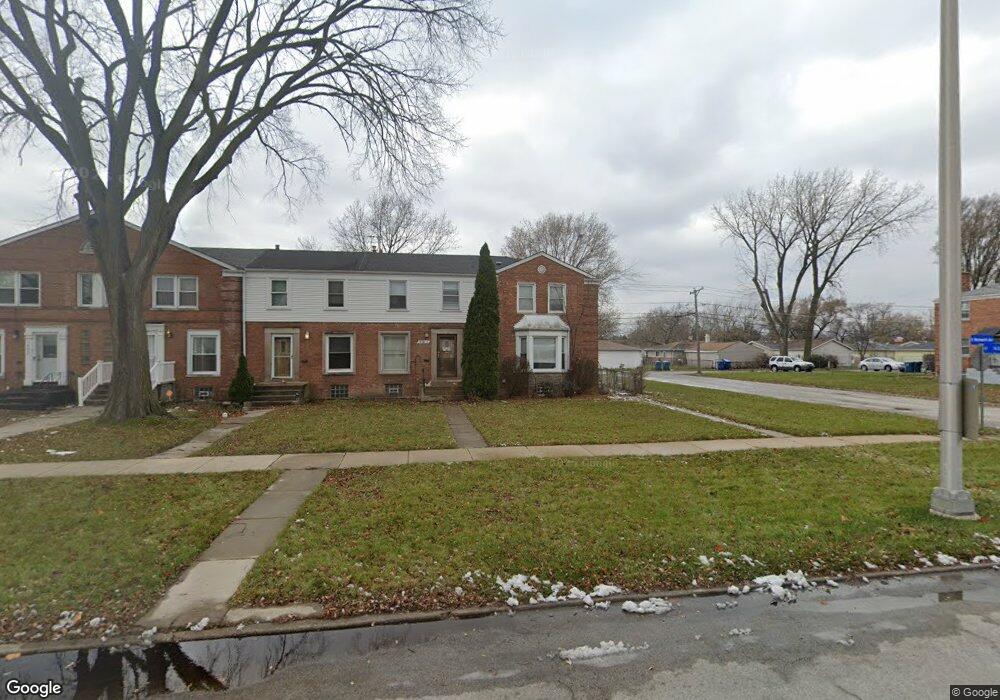
1400 Wentworth Ave Calumet City, IL 60409
Estimated Value: $117,000 - $126,000
2
Beds
1
Bath
962
Sq Ft
$127/Sq Ft
Est. Value
About This Home
This home is located at 1400 Wentworth Ave, Calumet City, IL 60409 and is currently estimated at $122,228, approximately $127 per square foot. 1400 Wentworth Ave is a home located in Cook County with nearby schools including Hoover Elementary School, Schrum Memorial Middle School, and Thornton Fractional North High School.
Ownership History
Date
Name
Owned For
Owner Type
Purchase Details
Closed on
Aug 28, 2023
Sold by
Slattery Joseph M
Bought by
Slattery Victoria M
Current Estimated Value
Purchase Details
Closed on
Nov 14, 2007
Sold by
Slattery Joan C
Bought by
Slattery Joan C and Provision Of A Trust
Purchase Details
Closed on
Jan 4, 2000
Sold by
Polusky Mary E and Polusky Renee M
Bought by
Slattery William R and Slattery Joan C
Home Financials for this Owner
Home Financials are based on the most recent Mortgage that was taken out on this home.
Original Mortgage
$46,400
Interest Rate
7.81%
Purchase Details
Closed on
Mar 20, 1996
Sold by
Lasalle National Trust Na
Bought by
Polusky Renee M and Polusky Mary E
Home Financials for this Owner
Home Financials are based on the most recent Mortgage that was taken out on this home.
Original Mortgage
$50,350
Interest Rate
6.98%
Mortgage Type
FHA
Create a Home Valuation Report for This Property
The Home Valuation Report is an in-depth analysis detailing your home's value as well as a comparison with similar homes in the area
Home Values in the Area
Average Home Value in this Area
Purchase History
| Date | Buyer | Sale Price | Title Company |
|---|---|---|---|
| Slattery Victoria M | -- | None Listed On Document | |
| Slattery Joan C | -- | Accommodation | |
| Slattery William R | $58,000 | Burnet Title Llc | |
| Polusky Renee M | $50,000 | -- |
Source: Public Records
Mortgage History
| Date | Status | Borrower | Loan Amount |
|---|---|---|---|
| Previous Owner | Slattery William R | $46,400 | |
| Previous Owner | Polusky Renee M | $50,350 |
Source: Public Records
Tax History Compared to Growth
Tax History
| Year | Tax Paid | Tax Assessment Tax Assessment Total Assessment is a certain percentage of the fair market value that is determined by local assessors to be the total taxable value of land and additions on the property. | Land | Improvement |
|---|---|---|---|---|
| 2024 | $2,973 | $8,500 | $904 | $7,596 |
| 2023 | $1,048 | $8,500 | $904 | $7,596 |
| 2022 | $1,048 | $4,652 | $798 | $3,854 |
| 2021 | $1,104 | $4,650 | $797 | $3,853 |
| 2020 | $1,094 | $4,650 | $797 | $3,853 |
| 2019 | $285 | $3,813 | $744 | $3,069 |
| 2018 | $282 | $3,813 | $744 | $3,069 |
| 2017 | $311 | $3,813 | $744 | $3,069 |
| 2016 | $739 | $3,594 | $691 | $2,903 |
| 2015 | $645 | $3,594 | $691 | $2,903 |
| 2014 | -- | $3,594 | $691 | $2,903 |
| 2013 | $722 | $3,852 | $691 | $3,161 |
Source: Public Records
Map
Nearby Homes
- 1374 Kenilworth Dr
- 1404 Wentworth Ave Unit 1
- 1375 Forest Place
- 1420 Wentworth Ave
- 107 163rd St
- 1373 Stanley Blvd
- 43 163rd St
- 1461 Wentworth Ave
- 1395 Freeland Ave
- 1473 Wentworth Ave
- 1464 Shirley Dr
- 1481 Lincoln Ave
- 1351 Gordon Ave
- 1341 Gordon Ave
- 16 164th Place
- 1481 Lincoln Place
- 1304 Freeland Ave
- 1490 Lincoln Ave
- 1313 Gordon Ave
- 1387 Price Ave
- 1400 Wentworth Ave
- 1402 Wentworth Ave
- 1404 Wentworth Ave
- 1404 Wentworth Ave
- 1406 Wentworth Ave
- 1408 Wentworth Ave
- 1394 Wentworth Ave
- 1410 Wentworth Ave
- 1410 Wentworth Ave
- 1405 Forest Ave
- 1392 Wentworth Ave
- 1411 Forest Ave
- 1390 Wentworth Ave
- 1412 Wentworth Ave
- 1417 Forest Ave
- 1388 Wentworth Ave
- 1414 Wentworth Ave
- 1389 Forest Ave
- 1386 Wentworth Ave
- 1423 Forest Ave Unit 2