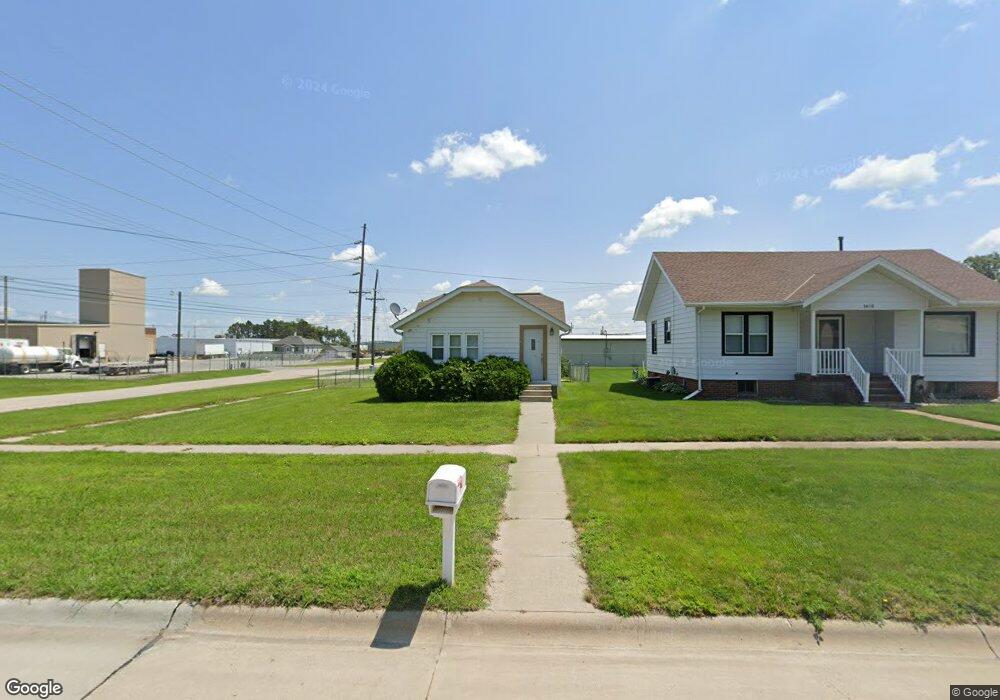
1401 Blaine St Norfolk, NE 68701
Estimated Value: $131,000 - $178,000
1
Bed
2
Baths
700
Sq Ft
$218/Sq Ft
Est. Value
About This Home
This home is located at 1401 Blaine St, Norfolk, NE 68701 and is currently estimated at $152,489, approximately $217 per square foot. 1401 Blaine St is a home located in Madison County with nearby schools including Norfolk Senior High School, Christ Lutheran School, and Keystone Christian Academy.
Ownership History
Date
Name
Owned For
Owner Type
Purchase Details
Closed on
Aug 31, 2017
Sold by
Martinez Ricardo M and Martinez Elizabeth
Bought by
Macias Martinez Erick A
Current Estimated Value
Home Financials for this Owner
Home Financials are based on the most recent Mortgage that was taken out on this home.
Original Mortgage
$81,400
Outstanding Balance
$70,686
Interest Rate
5.5%
Mortgage Type
FHA
Estimated Equity
$81,803
Purchase Details
Closed on
Aug 28, 2013
Sold by
Gronau Ross L
Bought by
Martinez Ricardo M
Home Financials for this Owner
Home Financials are based on the most recent Mortgage that was taken out on this home.
Original Mortgage
$77,000
Interest Rate
4.36%
Mortgage Type
VA
Purchase Details
Closed on
Jul 12, 2004
Sold by
Classen Matthew M
Bought by
Gronau Ross L
Purchase Details
Closed on
Dec 14, 2001
Sold by
Elkhorn Valley Community Dev Corp
Bought by
Classen Matthew M and Classen Jamie M
Create a Home Valuation Report for This Property
The Home Valuation Report is an in-depth analysis detailing your home's value as well as a comparison with similar homes in the area
Home Values in the Area
Average Home Value in this Area
Purchase History
| Date | Buyer | Sale Price | Title Company |
|---|---|---|---|
| Macias Martinez Erick A | $100,000 | Stewart Title Company | |
| Martinez Ricardo M | $78,000 | Ne Ne Title & Escrow | |
| Gronau Ross L | $58,000 | -- | |
| Classen Matthew M | $54,500 | -- |
Source: Public Records
Mortgage History
| Date | Status | Borrower | Loan Amount |
|---|---|---|---|
| Open | Macias Martinez Erick A | $81,400 | |
| Previous Owner | Martinez Ricardo M | $77,000 |
Source: Public Records
Tax History Compared to Growth
Tax History
| Year | Tax Paid | Tax Assessment Tax Assessment Total Assessment is a certain percentage of the fair market value that is determined by local assessors to be the total taxable value of land and additions on the property. | Land | Improvement |
|---|---|---|---|---|
| 2024 | $1,219 | $97,348 | $6,683 | $90,665 |
| 2023 | $1,594 | $86,214 | $6,683 | $79,531 |
| 2022 | $1,440 | $77,693 | $6,683 | $71,010 |
| 2021 | $1,297 | $70,085 | $6,683 | $63,402 |
| 2020 | $1,167 | $63,292 | $6,683 | $56,609 |
| 2019 | $1,093 | $57,227 | $6,683 | $50,544 |
| 2018 | $1,075 | $57,227 | $6,683 | $50,544 |
| 2017 | $998 | $53,054 | $6,683 | $46,371 |
| 2016 | $893 | $47,370 | $5,967 | $41,403 |
| 2015 | $893 | $47,370 | $5,967 | $41,403 |
| 2014 | $920 | $47,370 | $5,967 | $41,403 |
| 2013 | $895 | $44,661 | $5,967 | $38,694 |
Source: Public Records
Map
Nearby Homes
- 1405 S 2nd St
- 1406 S 2nd St
- 1303 S 3rd St
- 1104 S 2nd St
- 922 S 2nd St
- 809 S 1st St
- 804 Volkman Dr
- 906 S 4th St
- 918 S 5th St
- 700 S 2nd St
- 1100 Prime Stop Way
- 501 E Pasewalk Ave
- 805 S 5th St
- 1001 Prime Stop Way
- 606 S Boxelder St
- 2208 S 1st St
- 506 S 1st St
- 605 E Park Ave
- 1210 Prime Stop Way
- 1104 Southern Dr
- 1403 Blaine St
- 1400 Blaine St
- 1405 Blaine St
- 1402 Blaine St
- 1409 Blaine St
- 1406 Blaine St
- 1314 Blaine St
- 1408 Blaine St
- 1312 Blaine St
- 1410 Blaine St
- 1411 Blaine St
- 1306 Blaine St
- 1403 Pierce St
- 1405 Pierce St
- 1311 Pierce St
- 1309 Pierce St
- 1401 Pierce St
- 1307 Pierce St
- 1411 Pierce St
- 206 E Omaha Ave Unit 1306 & 1312 Blaine S