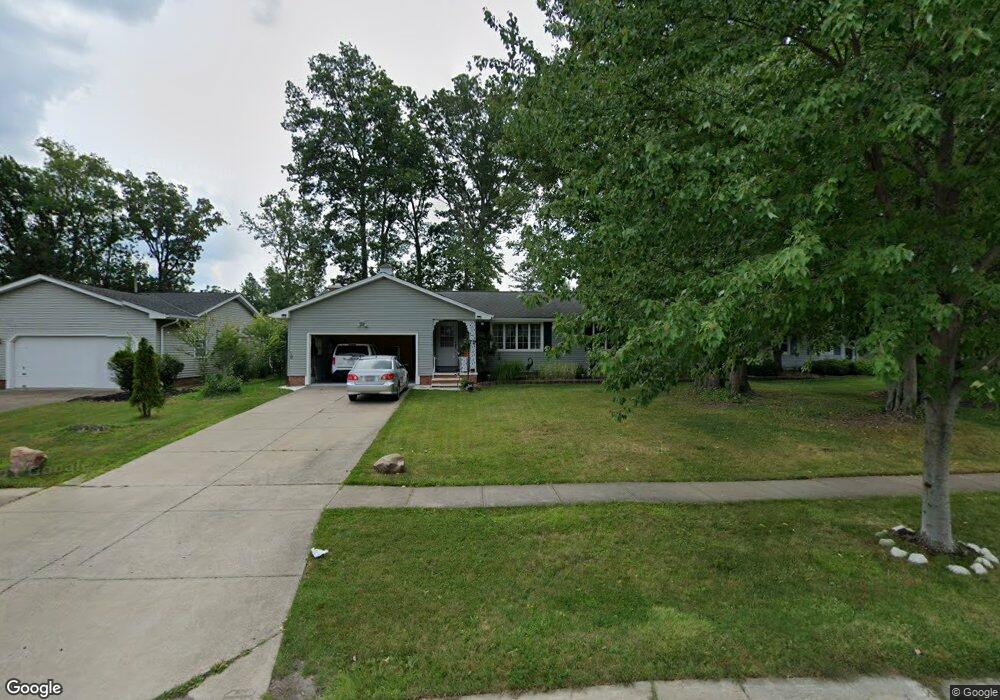
14017 Cherokee Trail Middleburg Heights, OH 44130
Estimated Value: $278,000 - $300,000
3
Beds
2
Baths
1,480
Sq Ft
$198/Sq Ft
Est. Value
About This Home
This home is located at 14017 Cherokee Trail, Middleburg Heights, OH 44130 and is currently estimated at $293,321, approximately $198 per square foot. 14017 Cherokee Trail is a home located in Cuyahoga County with nearby schools including Big Creek Elementary School, Berea-Midpark Middle School, and Berea-Midpark High School.
Ownership History
Date
Name
Owned For
Owner Type
Purchase Details
Closed on
Sep 29, 2011
Sold by
Barress Philip B and Barress David C
Bought by
Veras Radhames and Veras Zoraida
Current Estimated Value
Home Financials for this Owner
Home Financials are based on the most recent Mortgage that was taken out on this home.
Original Mortgage
$134,330
Outstanding Balance
$92,933
Interest Rate
4.4%
Mortgage Type
FHA
Estimated Equity
$200,388
Purchase Details
Closed on
Dec 3, 2009
Sold by
Barres Philip B
Bought by
Barress Philip B
Purchase Details
Closed on
Feb 19, 2005
Sold by
Barress Philip B
Bought by
Barress Philip B
Purchase Details
Closed on
May 12, 2004
Sold by
Estate Of Laura P Barress
Bought by
Barress Philip B
Purchase Details
Closed on
Jan 1, 1975
Bought by
Barress Philip B and Barress Laura P
Create a Home Valuation Report for This Property
The Home Valuation Report is an in-depth analysis detailing your home's value as well as a comparison with similar homes in the area
Home Values in the Area
Average Home Value in this Area
Purchase History
| Date | Buyer | Sale Price | Title Company |
|---|---|---|---|
| Veras Radhames | $139,000 | Guardian Title | |
| Barress Philip B | -- | Attorney | |
| Barress Philip B | -- | -- | |
| Barress Philip B | -- | -- | |
| Barress Philip B | -- | -- |
Source: Public Records
Mortgage History
| Date | Status | Borrower | Loan Amount |
|---|---|---|---|
| Open | Veras Radhames | $134,330 |
Source: Public Records
Tax History Compared to Growth
Tax History
| Year | Tax Paid | Tax Assessment Tax Assessment Total Assessment is a certain percentage of the fair market value that is determined by local assessors to be the total taxable value of land and additions on the property. | Land | Improvement |
|---|---|---|---|---|
| 2024 | $4,864 | $92,155 | $19,425 | $72,730 |
| 2023 | $4,038 | $62,760 | $14,770 | $47,990 |
| 2022 | $4,011 | $62,760 | $14,770 | $47,990 |
| 2021 | $3,989 | $62,760 | $14,770 | $47,990 |
| 2020 | $3,911 | $54,110 | $12,740 | $41,370 |
| 2019 | $3,801 | $154,600 | $36,400 | $118,200 |
| 2018 | $3,528 | $54,110 | $12,740 | $41,370 |
| 2017 | $3,524 | $46,310 | $12,080 | $34,230 |
| 2016 | $3,496 | $46,310 | $12,080 | $34,230 |
| 2015 | $3,204 | $46,310 | $12,080 | $34,230 |
| 2014 | $3,204 | $44,950 | $11,730 | $33,220 |
Source: Public Records
Map
Nearby Homes
- 13541 Indian Creek Dr
- 7664 Gerald Dr
- 14280 Pawnee Trail
- 14330 Pawnee Trail
- 7596 W 130th St
- 7685 Saratoga Rd
- 14015 Byron Blvd
- 13976 W Sprague Rd
- 7601 W 130th St
- 7432 Baldwin Creek Dr
- 7547 N Linden Ln
- 12972 W Sprague Rd
- 13505 Old Pleasant Valley Rd
- 12939 W Pleasant Valley Rd
- 8761 Windfall Ct
- 7330 Maplewood Rd
- 7444 Briarcliff Pkwy
- 14750 Seneca Trail
- 7280 Pearl Rd
- 7364 Pearl Rd
- 13985 Cherokee Trail
- 14049 Cherokee Trail
- 14008 Indian Creek Dr
- 13955 Cherokee Trail
- 13980 Indian Creek Dr
- 14040 Indian Creek Dr
- 13952 Indian Creek Dr
- 14018 Cherokee Trail
- 14061 Cherokee Trail
- 13986 Cherokee Trail
- 14050 Cherokee Trail
- 13923 Cherokee Trail
- 14060 Indian Creek Dr
- 13924 Indian Creek Dr
- 13956 Cherokee Trail
- 14091 Cherokee Trail
- 14060 Cherokee Trail
- 13924 Cherokee Trail
- 13891 Cherokee Trail
- 13896 Indian Creek Dr