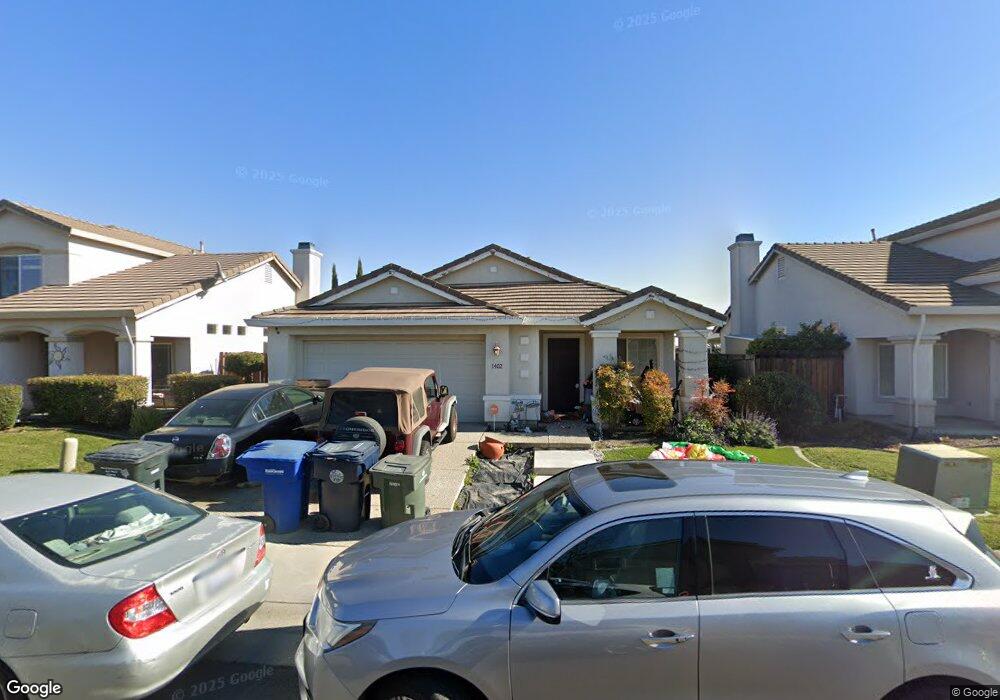
1402 Dreamy Way Sacramento, CA 95835
Village 12 NeighborhoodEstimated Value: $444,000 - $523,851
3
Beds
2
Baths
1,507
Sq Ft
$331/Sq Ft
Est. Value
About This Home
This home is located at 1402 Dreamy Way, Sacramento, CA 95835 and is currently estimated at $498,213, approximately $330 per square foot. 1402 Dreamy Way is a home located in Sacramento County with nearby schools including Regency Park Elementary School, Rio Linda Preparatory Academy, and Norwood Junior High School.
Ownership History
Date
Name
Owned For
Owner Type
Purchase Details
Closed on
Dec 8, 2015
Sold by
Mckay Veronica Ruiz and Mckay Dana Jon
Bought by
Mckay Veronica Ruiz
Current Estimated Value
Home Financials for this Owner
Home Financials are based on the most recent Mortgage that was taken out on this home.
Original Mortgage
$321,772
Outstanding Balance
$253,100
Interest Rate
3.71%
Mortgage Type
VA
Estimated Equity
$245,113
Purchase Details
Closed on
Mar 3, 2005
Sold by
Lennar Renaissance Inc
Bought by
Ruiz Veronica
Home Financials for this Owner
Home Financials are based on the most recent Mortgage that was taken out on this home.
Original Mortgage
$278,599
Interest Rate
6.95%
Mortgage Type
Purchase Money Mortgage
Purchase Details
Closed on
Jun 2, 2004
Sold by
Northpointe North Llc
Bought by
Lennar Renaissance Inc
Create a Home Valuation Report for This Property
The Home Valuation Report is an in-depth analysis detailing your home's value as well as a comparison with similar homes in the area
Home Values in the Area
Average Home Value in this Area
Purchase History
| Date | Buyer | Sale Price | Title Company |
|---|---|---|---|
| Mckay Veronica Ruiz | -- | Chicago Title Company | |
| Ruiz Veronica | $348,500 | North American Title Co | |
| Lennar Renaissance Inc | -- | -- |
Source: Public Records
Mortgage History
| Date | Status | Borrower | Loan Amount |
|---|---|---|---|
| Open | Mckay Veronica Ruiz | $321,772 | |
| Closed | Ruiz Veronica | $278,599 | |
| Closed | Ruiz Veronica | $69,649 |
Source: Public Records
Tax History Compared to Growth
Tax History
| Year | Tax Paid | Tax Assessment Tax Assessment Total Assessment is a certain percentage of the fair market value that is determined by local assessors to be the total taxable value of land and additions on the property. | Land | Improvement |
|---|---|---|---|---|
| 2025 | $6,842 | $485,761 | $195,139 | $290,622 |
| 2024 | $6,842 | $476,237 | $191,313 | $284,924 |
| 2023 | $6,882 | $466,900 | $187,562 | $279,338 |
| 2022 | $6,537 | $457,746 | $183,885 | $273,861 |
| 2021 | $5,836 | $395,091 | $158,714 | $236,377 |
| 2020 | $5,245 | $343,559 | $138,013 | $205,546 |
| 2019 | $5,082 | $330,346 | $132,705 | $197,641 |
| 2018 | $4,808 | $320,725 | $128,840 | $191,885 |
| 2017 | $4,853 | $308,390 | $123,885 | $184,505 |
| 2016 | $4,544 | $285,547 | $114,709 | $170,838 |
| 2015 | $4,203 | $271,950 | $109,247 | $162,703 |
| 2014 | $4,161 | $259,000 | $104,045 | $154,955 |
Source: Public Records
Map
Nearby Homes
- 5328 Allentown Way
- 5320 Allentown Way
- 5309 Allentown Way
- 5324 Dasco Way
- 5343 Dasco Way
- 5300 Allentown Way
- 7 Holliston Ct
- 15 Holliston Ct
- 27 Waban Ct
- 1459 Monkton Way
- 1455 Monkton Way
- Residence 2 Plan at East Village - Asheville
- Residence 1 Plan at East Village - Durham
- Residence 1 Plan at East Village - Bridgeport
- Residence 3 Plan at East Village - Bridgeport
- Residence 3 Plan at East Village - Durham
- Residence 3 Plan at East Village - Asheville
- Residence 2 Plan at East Village - Durham
- Residence 1 Plan at East Village - Asheville
- Residence 2 Plan at East Village - Bridgeport
- 1396 Dreamy Way
- 1408 Dreamy Way
- 1414 Dreamy Way
- 1390 Dreamy Way
- 5499 Lewrosa Way
- 1420 Dreamy Way
- 1520 Faletto Ave
- 5493 Lewrosa Way
- 1526 Faletto Ave
- 1426 Dreamy Way
- 1421 Dreamy Way
- 5489 Lewrosa Way
- 1501 Faletto Ave
- 1532 Faletto Ave
- 1432 Dreamy Way
- 1515 Faletto Ave
- 1427 Dreamy Way
- 1521 Faletto Ave
- 5483 Lewrosa Way
- 1538 Faletto Ave